Data visualization
Imagine you’re creating a prototype for an application to manage clients in your company. Since your company has many clients, you’ll need some way to display them in bulk, possibly in the form of cards or tables. You’ll also need a way to edit or delete individual clients from the list and have those changes maintained across different screens in your prototype. While a regular text table might work, it’s not very dynamic, and it’s hard to maintain if your data changes over time. How would you prototype this?
In Justinmind, Data Masters are what you’re looking for.
A Data Master is a list of information, similar to a database or spreadsheet. The data can be text or images, and consist of fields (column titles) and records (rows).
Follow along this article to learn how to use data in your prototypes:
Create a Data master
You’ll use a Data master to store your client information. Here’s how to create one:
- Look to the Data Masters palette in Justinmind. If you don’t see it, go to the Window menu and check Data Masters to be shown.
- Click the ‘+’ button in the palette to create a new Data Master. Here’s what to do next:
- a. Type in a name for the Data Master. In this example, call it “Clients”.
- b. Click the ‘+’ button to add a field. A field is the name of a column of data. Create four fields – “Name”, “Income”, “Contact”, and “Managed by:”.
- c. Select the type of data you’re adding. You’re only adding text in this example, so just leave the type as ‘text’.
- d. Click ‘OK’ to save your Data Master.
- Look again to the Data Masters palette and right-click on the Data Master you just created. You’ll see a new tab: ‘View and Edit records’.
- You’ll find “Sample text” written in each record. Click on a record to edit it and type in some information or data.
- Click the ‘+’ button to add more records.
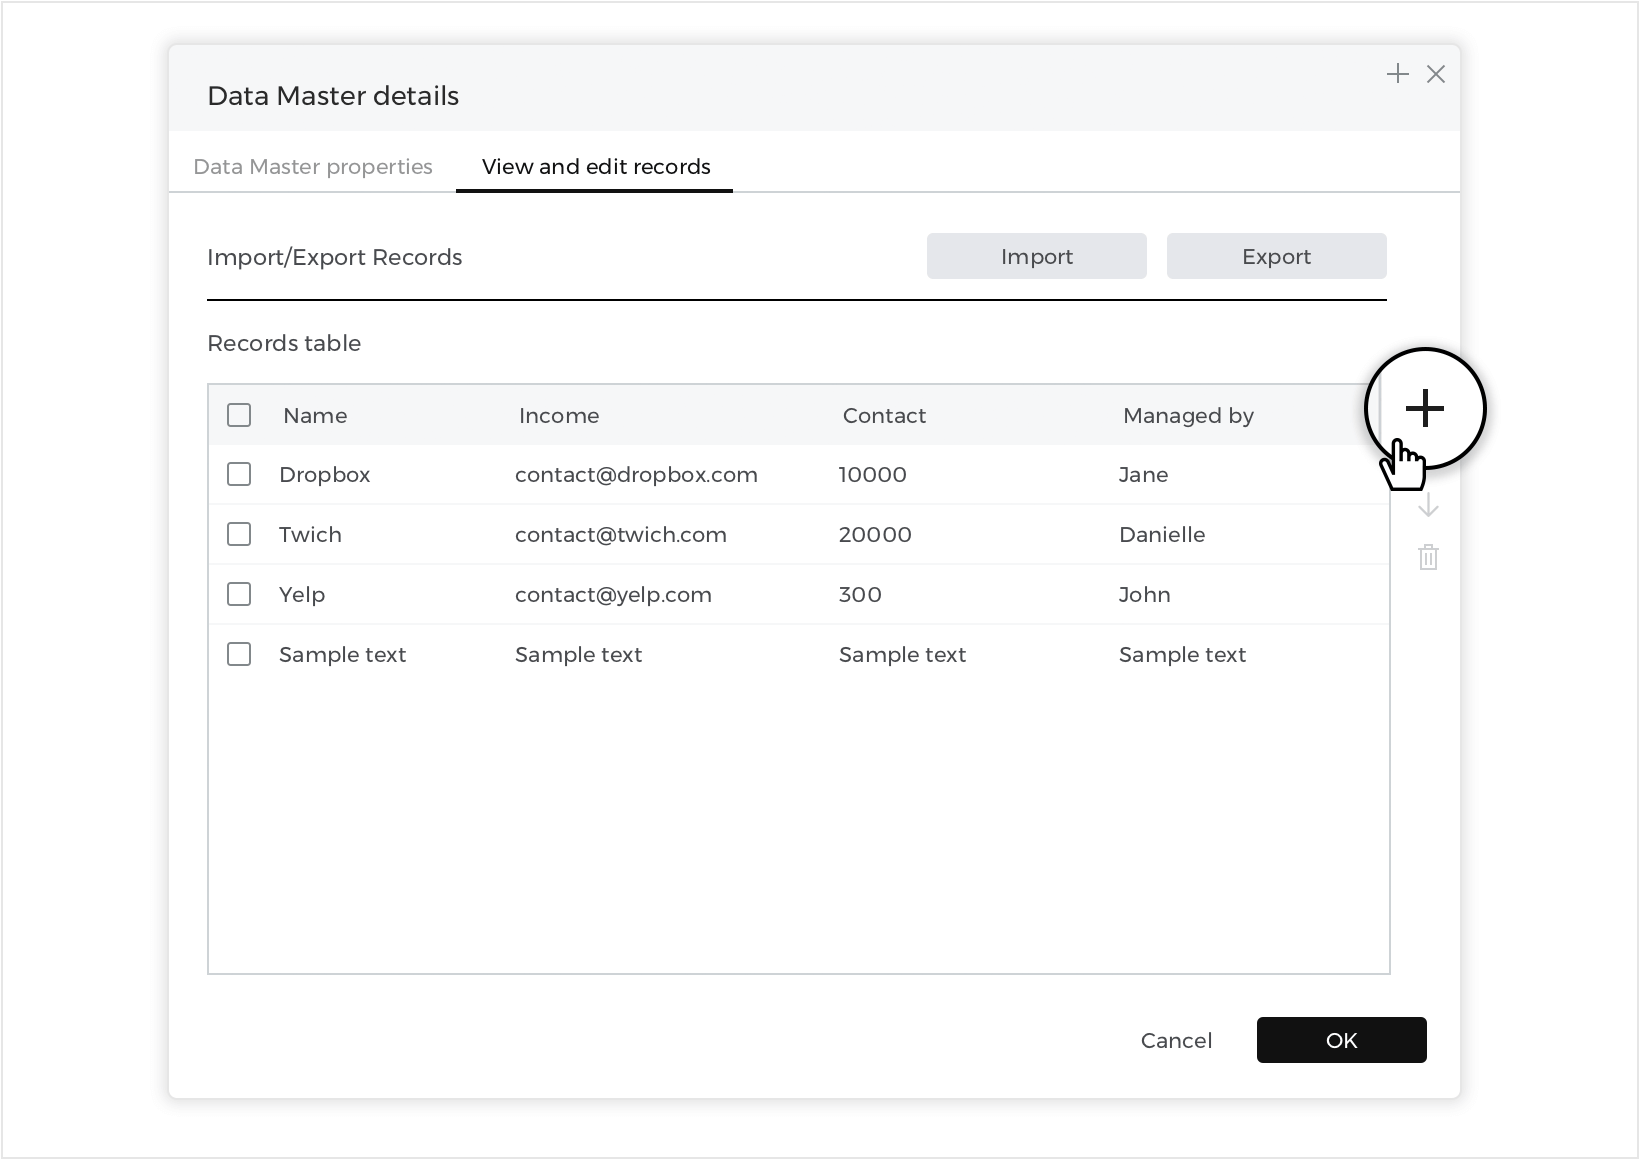
To delete a record, select it by clicking on the check box next to it and then click the ‘delete’ button.

Import data
You can also create a new Data Master directly from a .csv file:
Look to the Data Masters palette and click the ‘import’ button.

You’ll see a new dialog where you can name your data master, select the .csv file, and choose a field delimiter.
Display data
Now that you’ve entered in all of your client information into a Data Master, it’s time to display the data on the Canvas. In this example, you’ll learn how to display information in two ways: in card form with more detail and in a compact list with less detail.
Data grids
You’ll start by creating a card display:
- Go to the Toolbar dropdown and look to the ‘Dynamic content’ section.
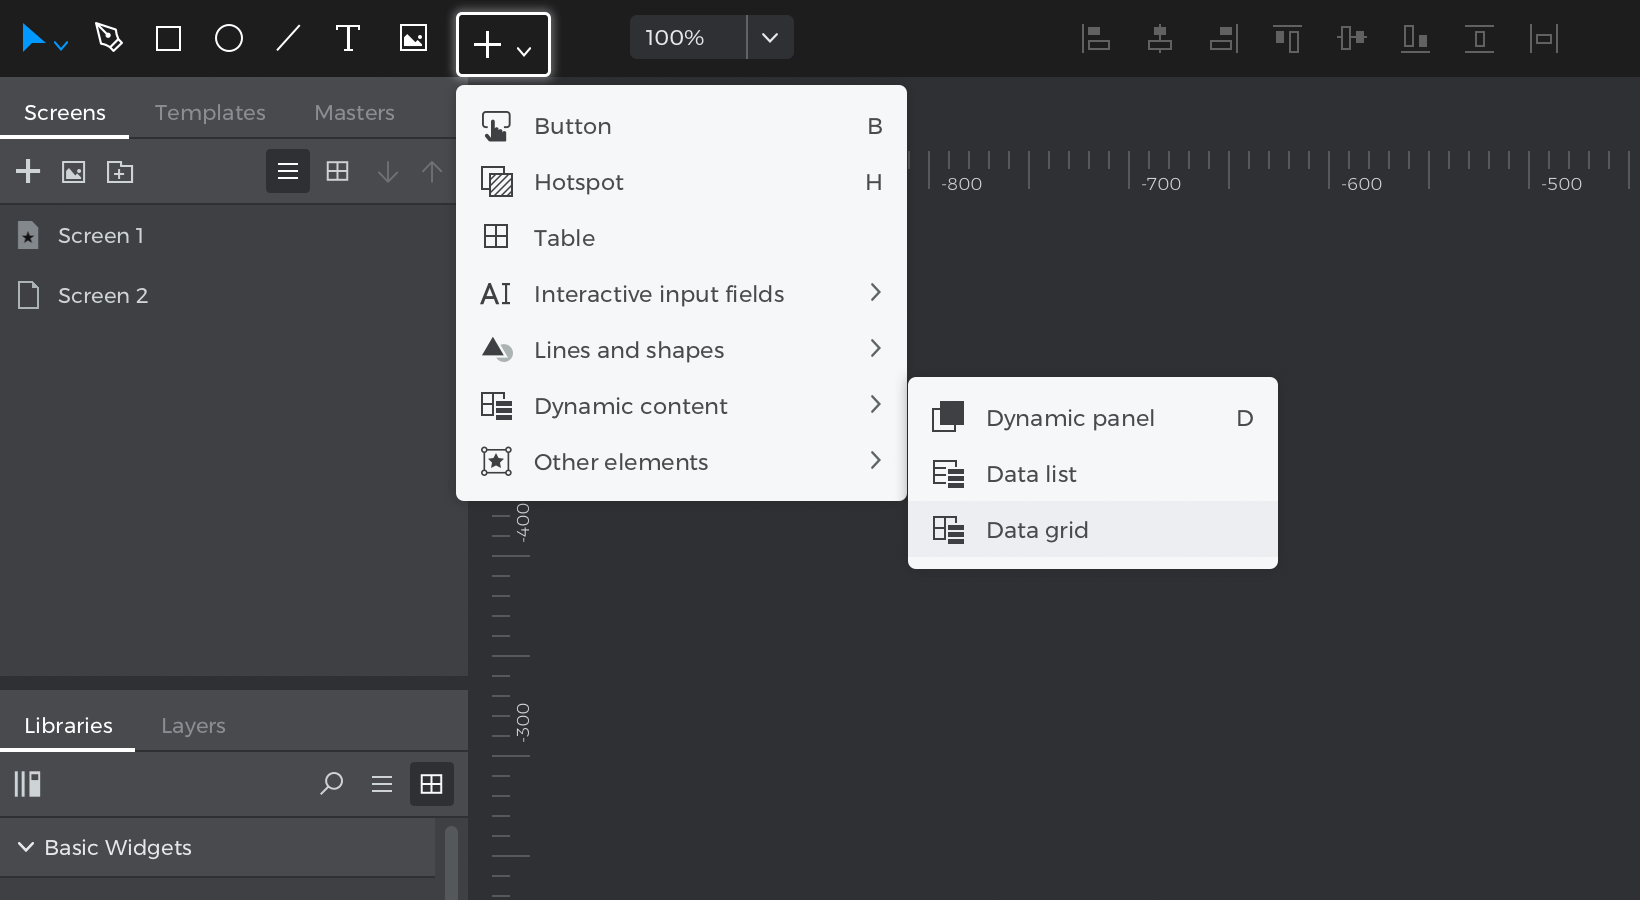

- Click on the Data Grid widget and you’ll see a new pop-up:
- a. Give your data grid a name. To match the example, name it “ClientCard”.
- b. Select the ‘Clients’ Data Master you created earlier to populate the data grid.
- c. Since you’ll want this card display to have more detail, you will include all fields in the data grid.Click the ‘>>’ button to move all fields into the data grid.
- Click ‘OK’ and place the data grid on the Canvas.
- Take a closer look at the data grid. You’ll see:
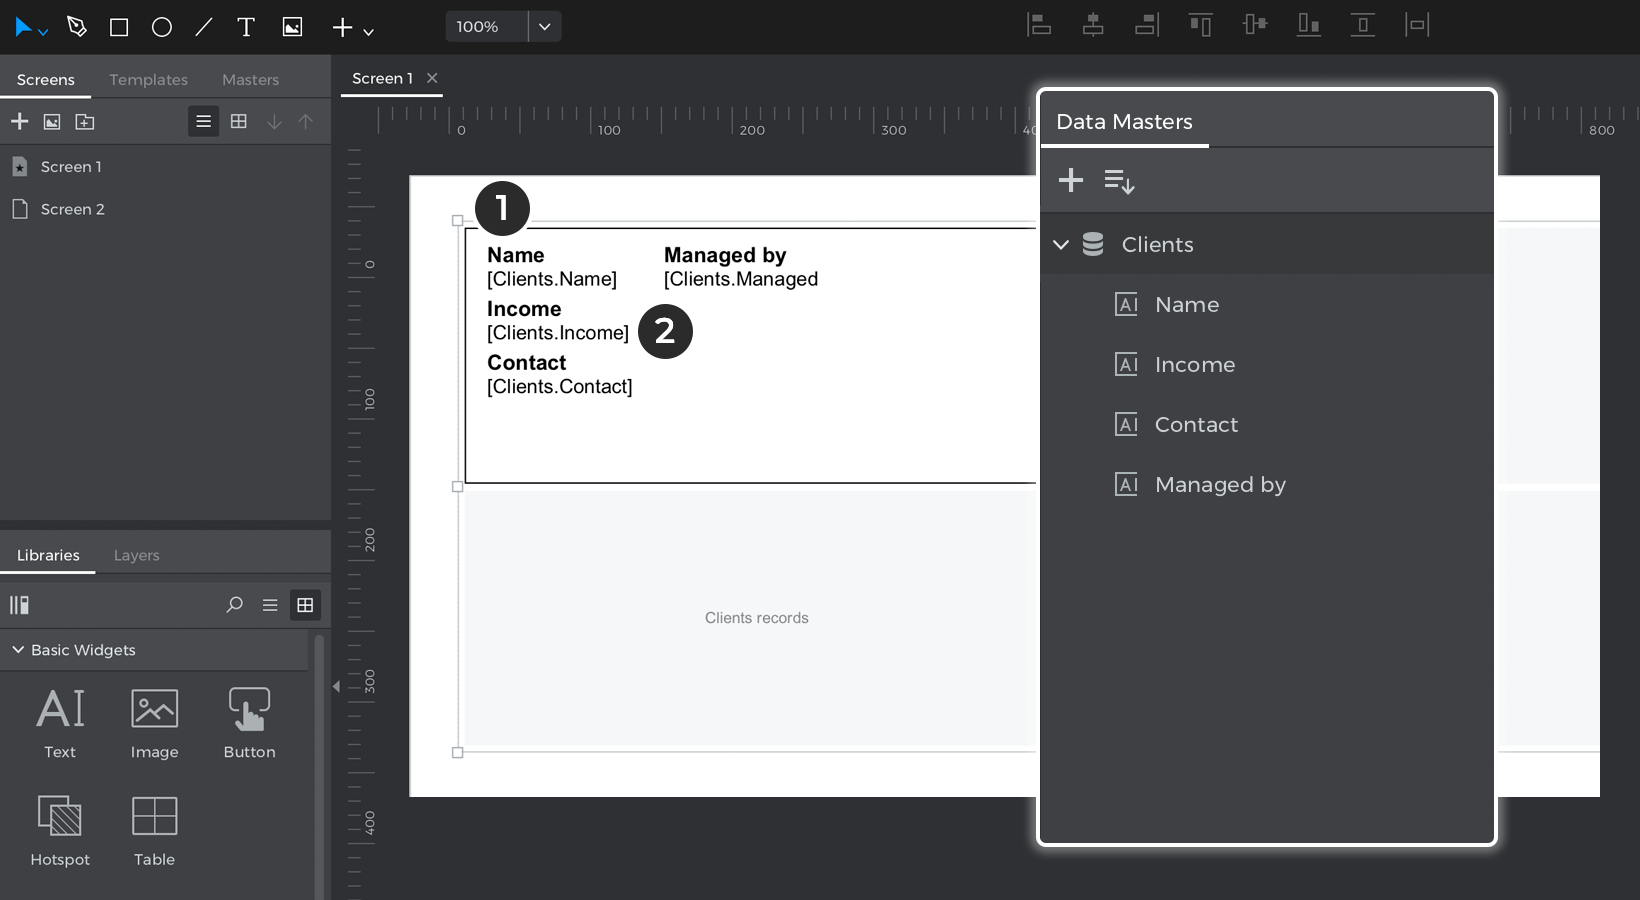

- The fields you named earlier. They are regular text elements.
- The records of the Data Master. They will appear in brackets and will show data during simulation.
Expand the Data Grid contents in the Layers palette, and you’ll see something called “Grid cell”. The grid cell serves as the preview of how all cells in the data grid will look and any changes or alterations you make to this cell will also appear in all other cells.
Click the ‘Play’ button simulate your prototype and see how your data grid displays all data you entered in the Data Master.
- Now that you know how a data grid is structured, you can customize its appearance:
- a. Hit the A key to activate the Direct Selection tool, which will allow you to easily select elements inside the data grid.
- a. Select the “Name”, “Income”, and “Contact” text elements, and delete them.
- b. Now with more space in the cell, move the remaining text elements and data fields around in the cell as you’d like.
- c. Switch back to regular selection mode by hitting V.With the grid cell still selected, use the indicators to resize the cell so it’s wider and longer.
- d. Place two Button B elements into the grid cell, naming them “Edit” and ‘Delete”. You can hold Command (on Mac) or Control (on Windows) to drag them inside.You’ll use these later to modify and delete clients from the Data Master.
- e. Select the entire data grid and look to the Properties palette. Change the number of columns to 3 and increase the vertical and horizontal spacing between cells.


You can further customize the data grid as you’d like. To match the example, you can also change the font family, size, and color, and the styles of the buttons.
Here’s how the Client Card dashboard looks when you simulate:
Data lists
Now you’ll create a compact list of client information in the form of a Data list:
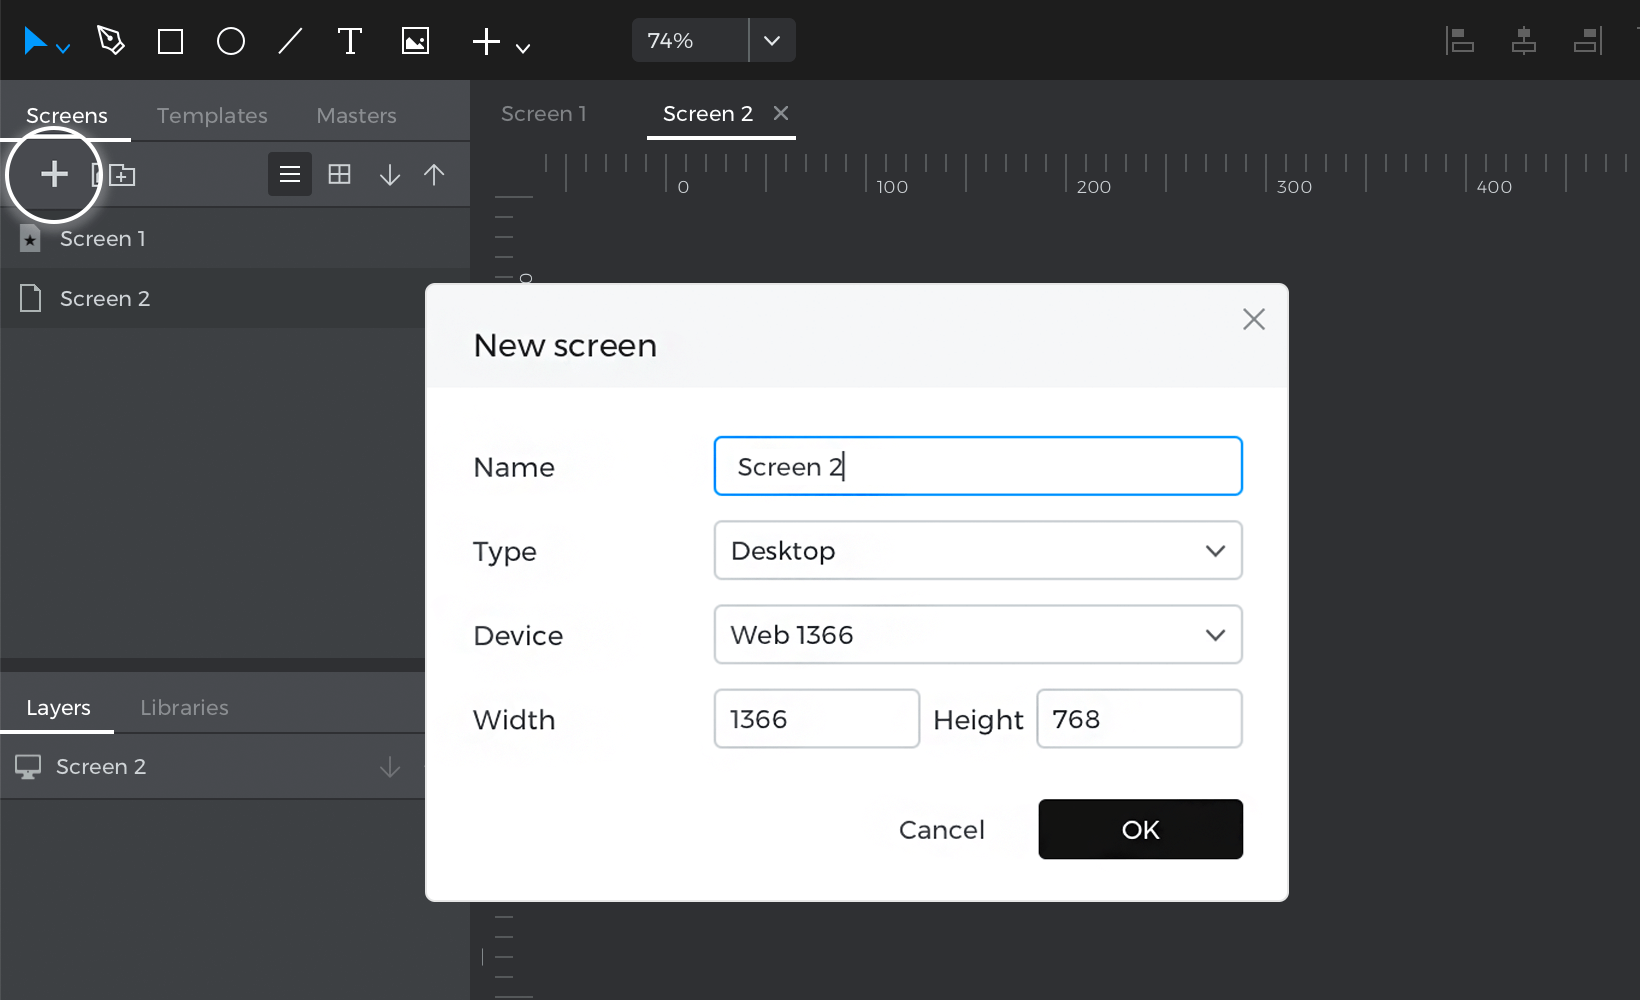
- Look to the Screens palette and click the ‘+’ button to add a new screen. Name it “Screen 2”.

- Go to the Toolbar dropdown and look to the ‘Dynamic content’ section.
- Click on the Data List widget and you’ll see a pop-up:
- a. Name the data list “ClientsList”.
- b. Select the “Clients” Data Master to populate the data list.
- c. Since you’ll want this card display to have less detail, only include some of the fields in the data list.Click on individual fields and click the ‘>’ button to move them to the data list. To match the example, leave out the “Income” field.
- d. Click ‘OK’ and place the data list on the Canvas.
- Take a closer look at the data list. You’ll see:
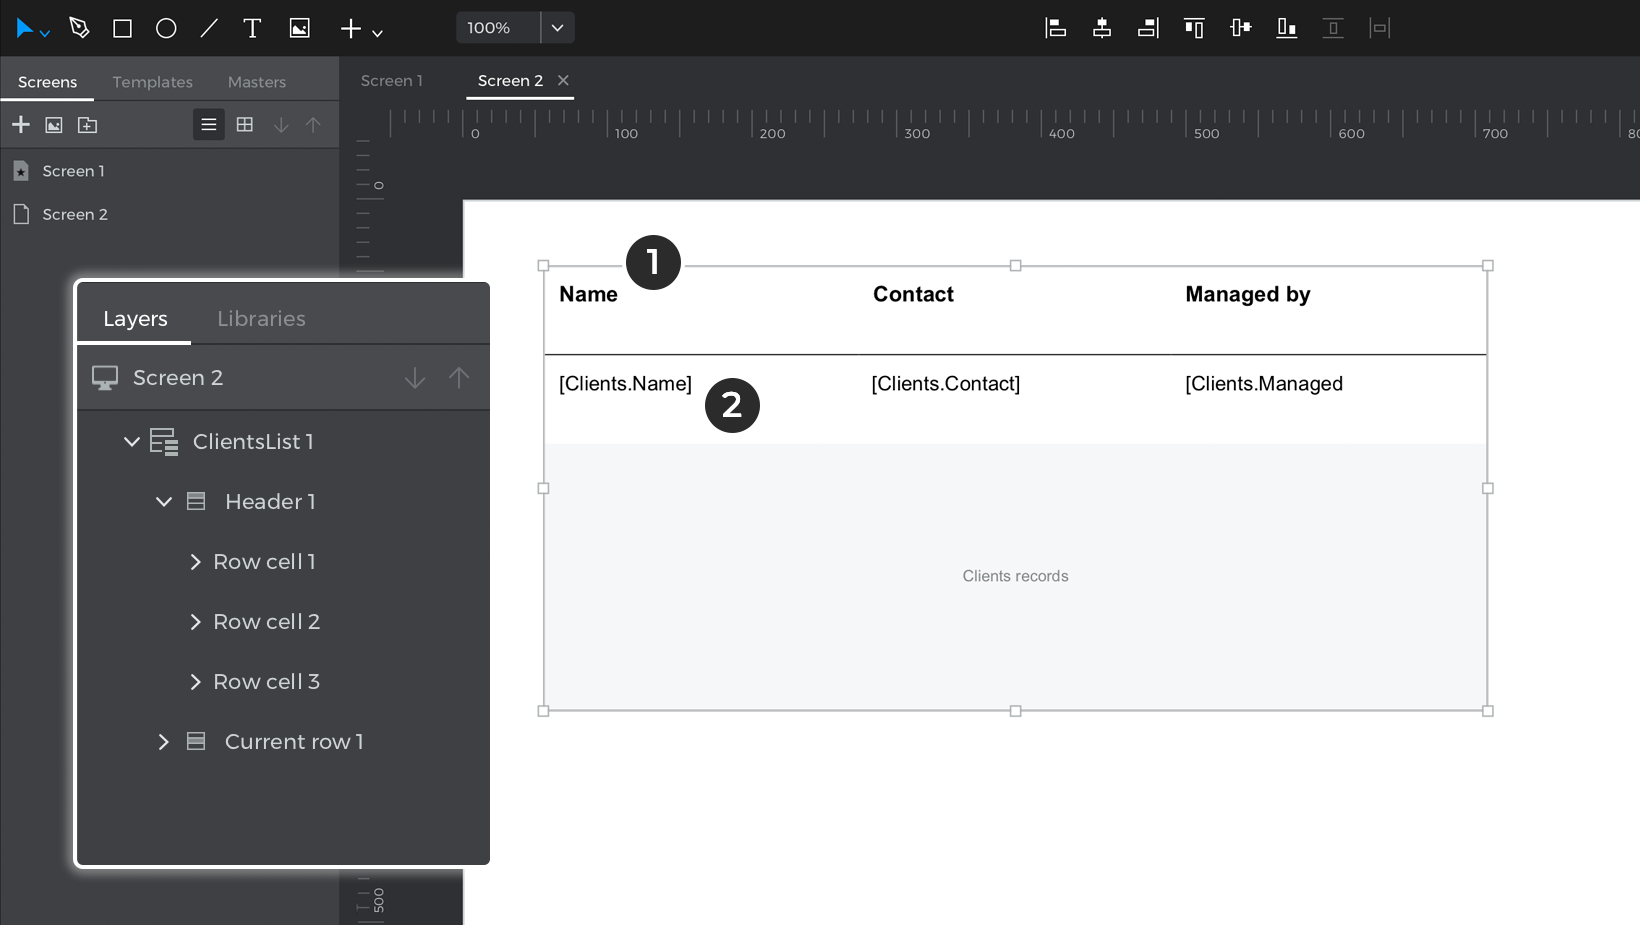

- The fields you named earlier.
- The records of the Data Master. They will appear in brackets and will show data during simulation.
Expand the data list contents in the Layers palette, and you’ll see something called “Current row”. Like the grid cell in the data grid, the current row serves as the preview of how all cells in the data list will look and any changes or alterations you make to this cell will also appear in all other cells.
- Click “Simulate” and see how your data list looks.
- Now that you know how a data list is structured, you can customize its appearance:
- a. Select “Header” (the data list header) and look to the Properties palette. There, change the ‘Layout’ to horizontal with centered alignment.
Select Current row and use the indicators that appear to drag down, which will increase the size of the rows in the data list. Change the ‘Layout’ to horizontal with centered alignment. - b. Select the entire data list and look to the Properties palette. Change the colors of the Odd/Even rows to transparent.
- c. Right-click on the data list and select ‘New column’.
- d. Use the Direct Selection tool A to place two Text Telements inside the row cell, labeling one “Edit”, and the other “Delete”. You’ll use these later to modify and delete clients from the Data Master.
- a. Select “Header” (the data list header) and look to the Properties palette. There, change the ‘Layout’ to horizontal with centered alignment.


You can further customize the data list as you’d like. To match the example, you can also change the font family, size, and color of the text, and remove some of the borders.
Here’s how the Client List dashboard looks when you simulate:
Modify data
So far, you’ve created and customized the appearance of the client information in several ways. Now you’ll learn how to add, edit, and delete records from these lists.
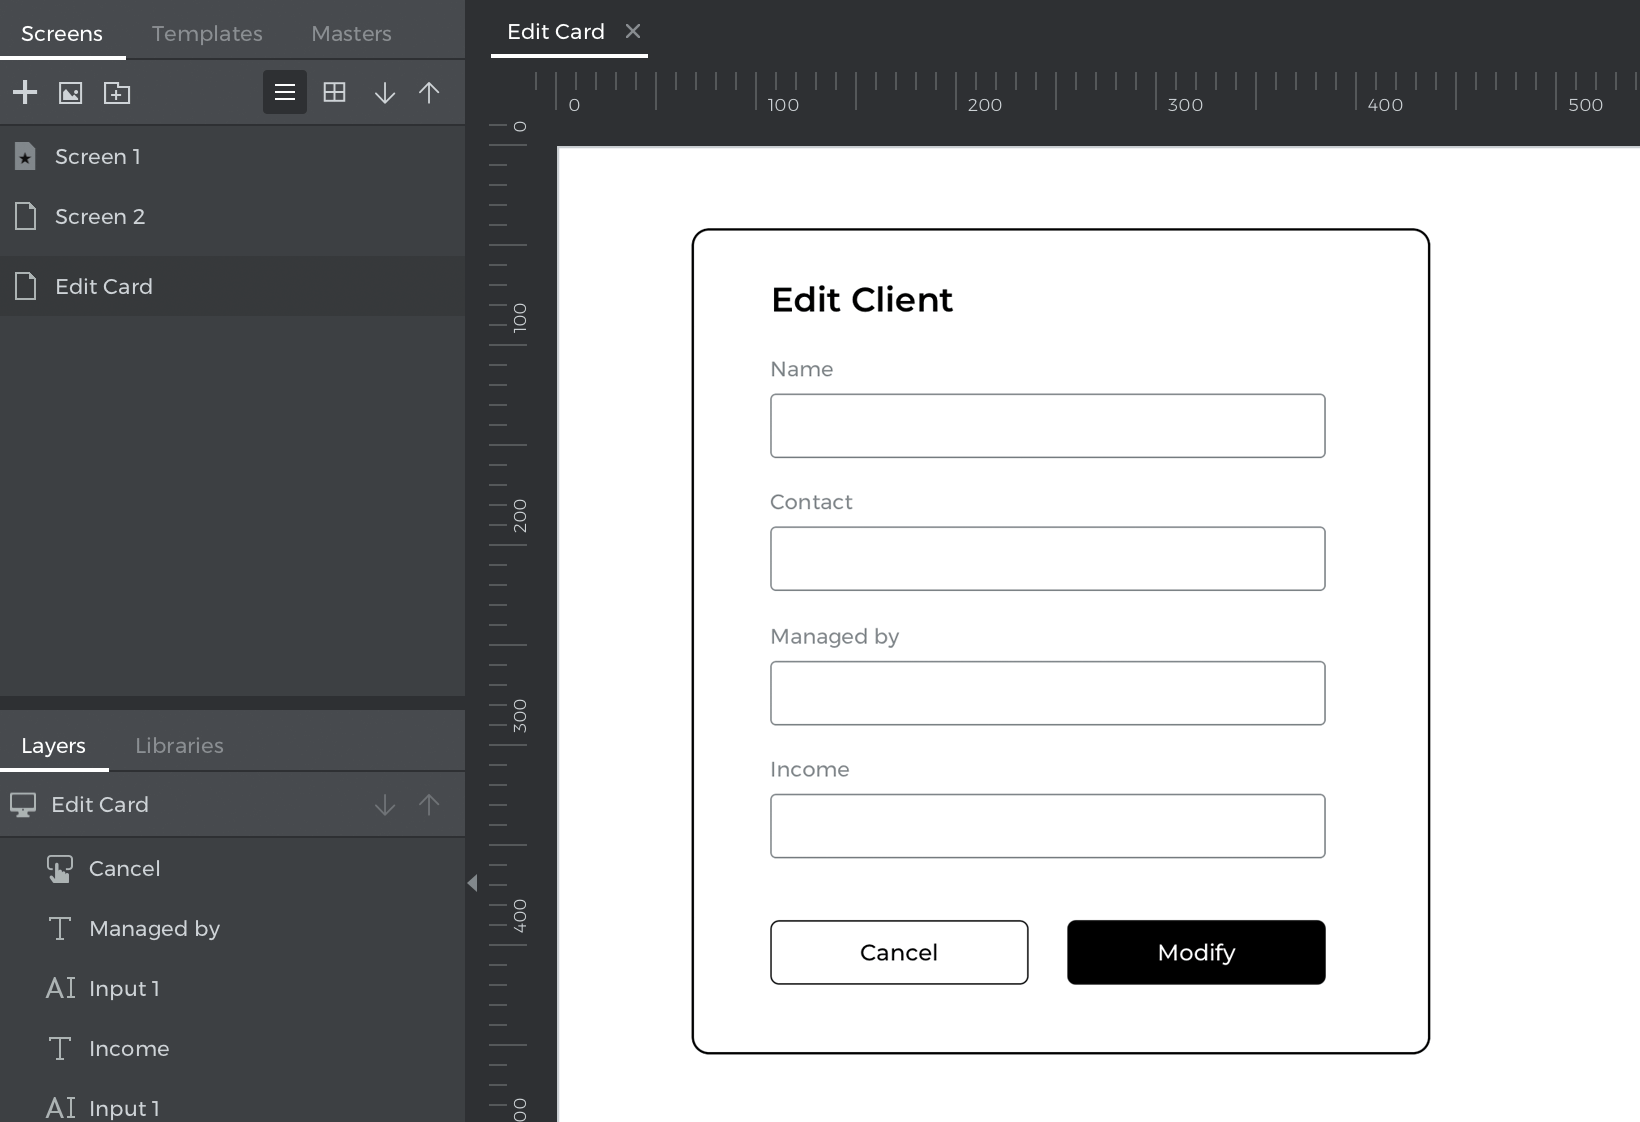
- You’ll first need to create a new screen. Name it “Edit Card” – you’ll edit a selected client’s information on this screen.
- Drag four Input Text Fields F to the Canvas. Add a button below the form and rename it “Modify”. Add another button next to it, naming it “Cancel”. Customize the appearance of the form as you’d like.

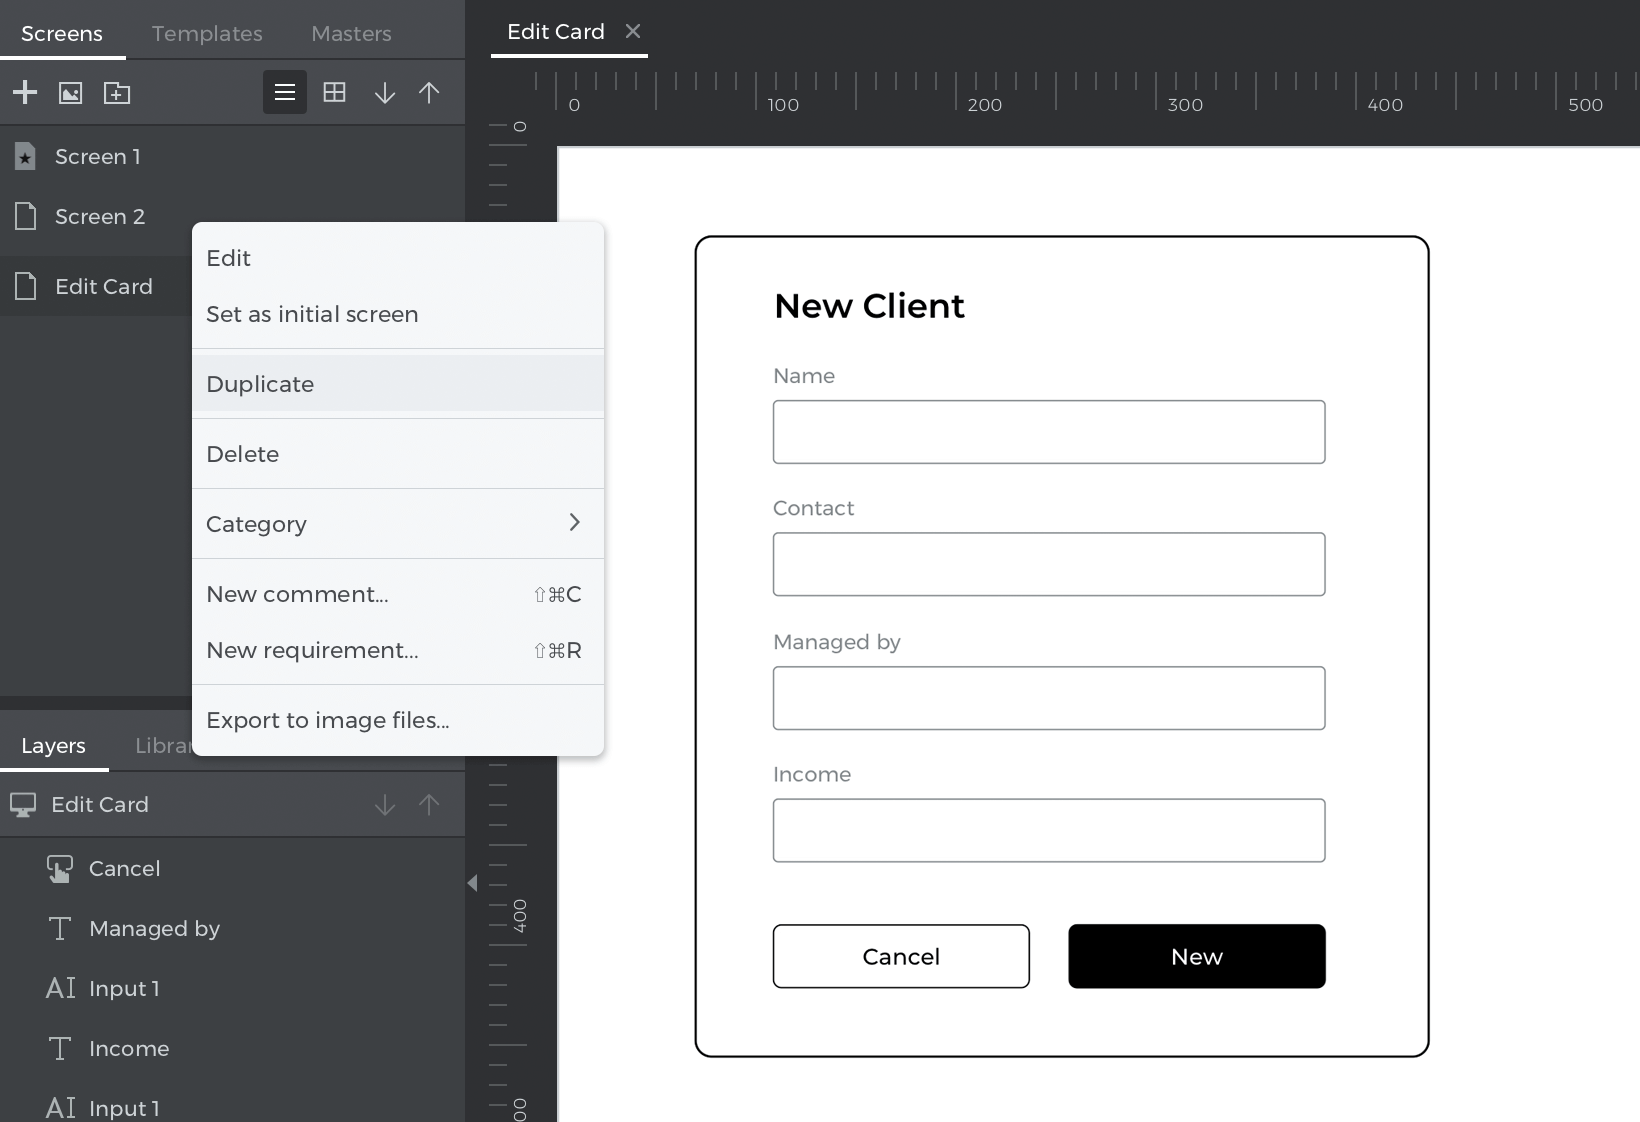
- Right-click on this screen in the Screens palette and click ‘Duplicate’. Name this screen “New Card”.


Add new client records
In this section, you’ll learn how to add new records to a data master.
- Go to the Card Dashboard screen and place a button element onto the Canvas, naming it “New”.
- With that button selected, create an On Click + Navigate To event, linking to the “New Client” screen you created earlier.
- Go to the New Client screen and select the “Add” button. Create an On Click + Data Master Action event. Click the ‘New’ button and you’ll see the Value Expression builder appear.Here’s the structure of the Data Master Action – New event:
- Each ‘Field’ in the Data Master.
- The values that will be added to the Data Master and will be reflected in the data list and data grid.
- Drag each corresponding input text field to the open spaces in the expression and click ‘OK’.
- With the “Add” button still selected, create an On Click + Navigate To event, selecting the ‘Previous screen’ radio button as the link target.
- Select the “Cancel” button and create the same event as in the last step.
- Go to the List Dashboard screen and place a button on the Canvas, labeling it “New”. Create an On Click + Navigate To event for this button, linking to the “New Client” screen.
Both screens should now be linked to where you can add new information to the data master. Click the ‘Play’ button to simulate your prototype. Tap the “New” button, which will link you to the New Client screen. Enter some information in the form and tap “Add”. You’ll see a new record added to the card.
Modify client records
To edit the client records, you’ll need some way to select a specific row to modify. You’ll use the special functionality of “Current row” (in data lists) and “Grid cell” (in data grids) to select a row – they are able to detect the row you interact with during simulation.
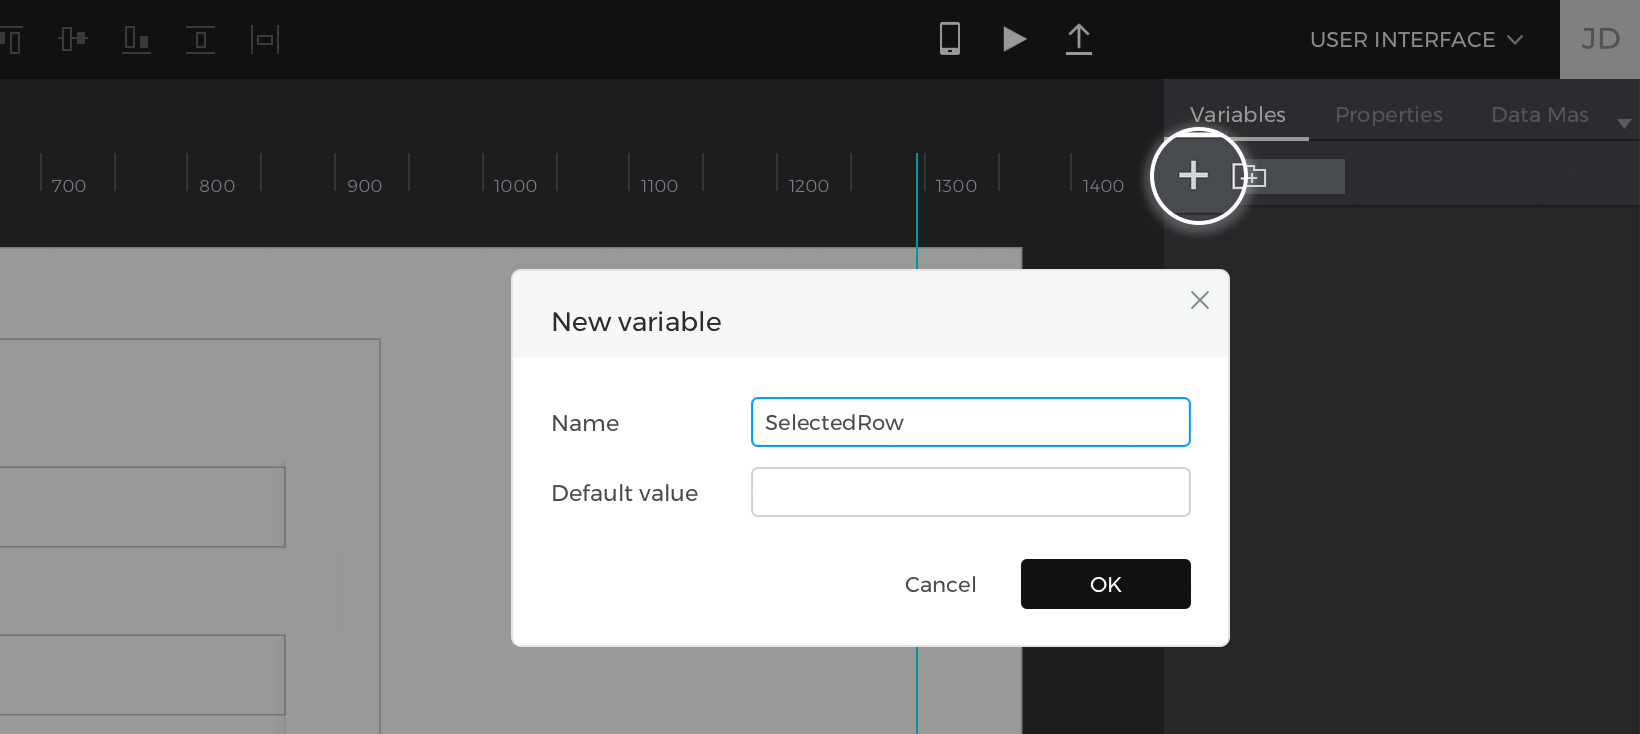
After selecting a row, you need to store that row’s information somewhere so you can place it into an input text field to edit it. In this example, you’ll use a Variable, which can store whole rows of client information at a time.
- Look to the Variables palette and create a variable named “SelectedRow” with a blank default value.

- Go to the Card Dashboard screen and select the “Edit” button you placed into the grid cell earlier.
- Create an On Click + Set Value event, selecting the SelectedRow variable as the target of the action.For the value, click ‘Calculated’ and the ‘Add expression’ text link.
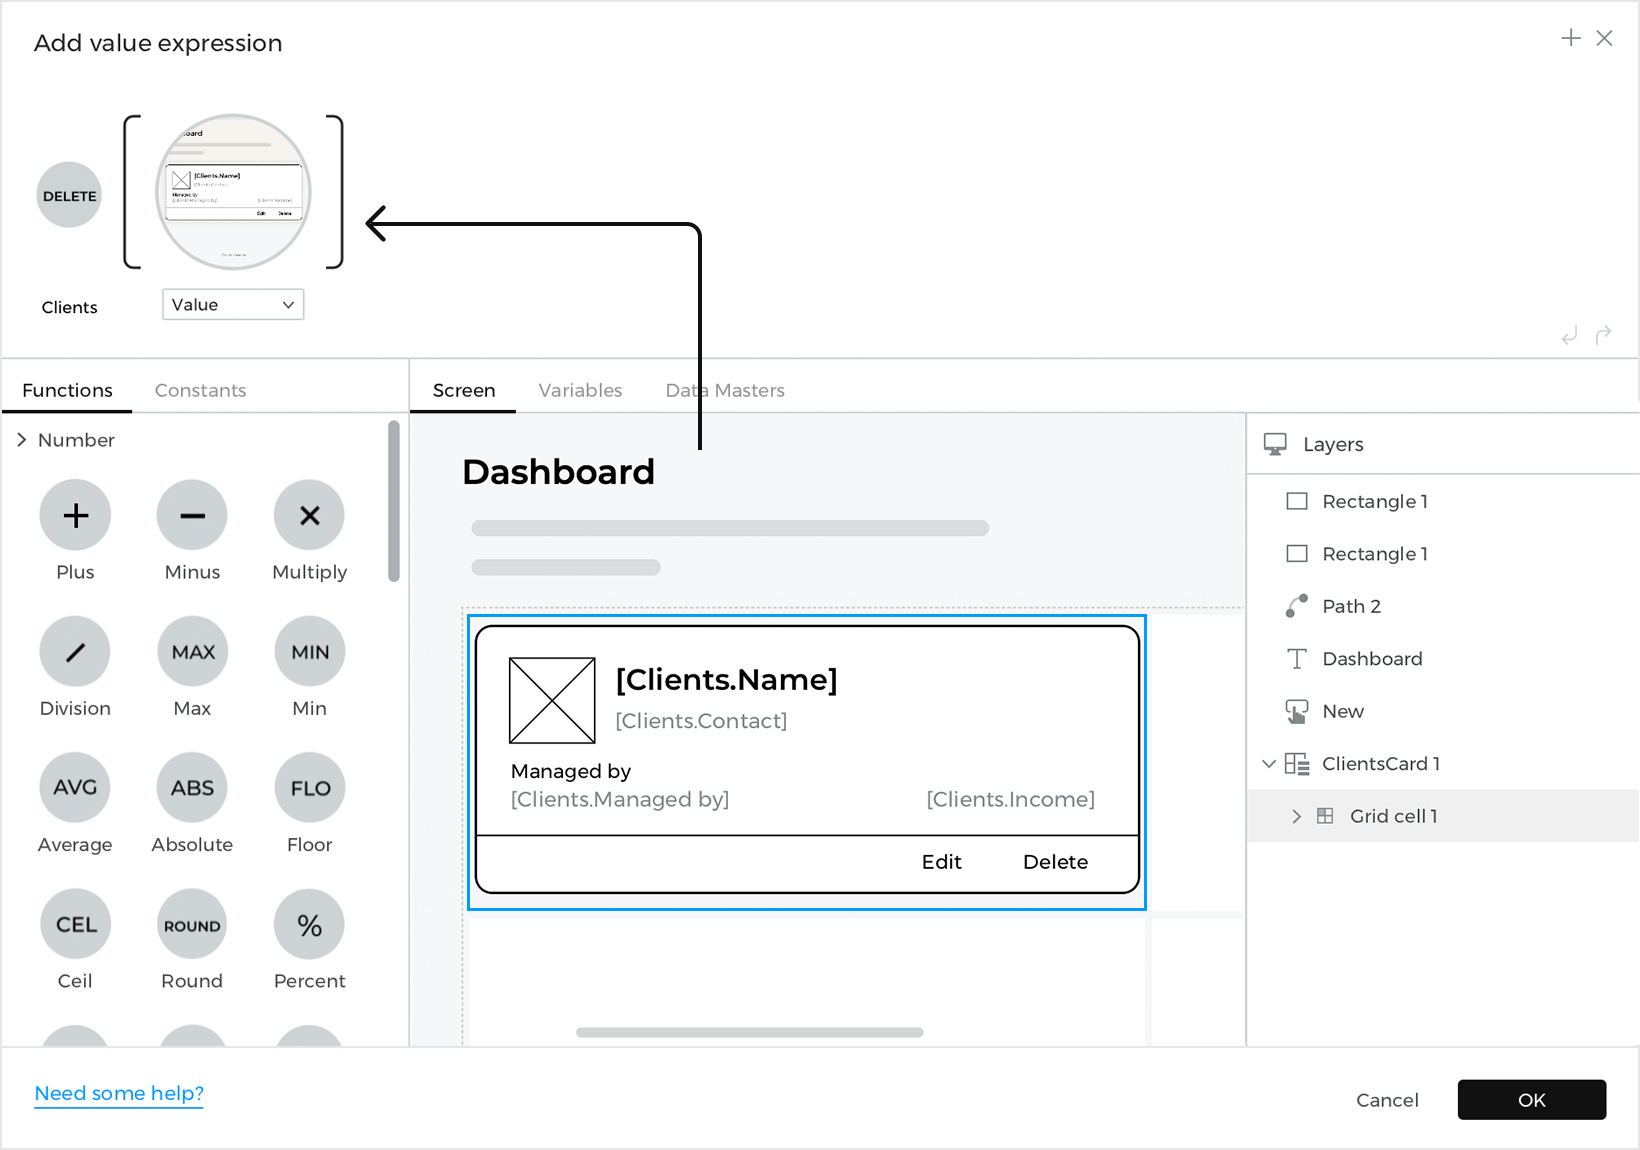
- You’ll see the Value Expression builder appear. Drag the grid cell to the open space in the expression. It might be easier to select and drag it from the builder layers rather than the Canvas preview. Click ‘OK’ to finish building the expression.This event will transfer the values of the card you just clicked to the variable.
- Look back to the Events palette to see the event you just created. Add an On Click + Navigate To event for the “Edit” button, linking to the “Edit Client” screen.
- Go to the Edit Client screen. Double-click on the Canvas to select the base screen.
- Create an On Page Load + Set Value event, selecting the “Name” input text field as the target of the action. For the value, click ‘Calculated’, and then ‘Add expression’. You’ll see the Value Expression builder appear. To build the expression:

- Drag the Select function to the open space in the expression.
- You’ll see two new spaces appear in the expression. Drag the “SelectedRow” to the space on the left.
- Click to the Data Masters tab in the builder and expand the Data Master so you can see the attributes (the Data Master fields).Drag the “Name” attribute to the second space in the expression.
Repeat steps 6 and 7 for the other input text fields, making sure to change the target of the action and the attribute in the expression each time.
- Now you’ll create the events to change the client information. Select the “Modify” button at the bottom of the form and create an On Click + Data Master Action – Modify event. This will open the Value Expression builder.Here’s how this event works:
- The open space where you’ll define the row that will be modified.
- The open spaces where you’ll specify the information that will be changed in the Data Master.
- Place the SelectedRow variable in the first open space on the left. Drag the corresponding input text fields to the open spaces in the expression and click ‘OK’ to finish building the event.
- Back on the Canvas, and with the “Modify” button still selected, create an On Click + Navigate To event, selecting the ‘Previous screen’ radio button.
- Select the “Cancel” button and create an On Click + Navigate To event, selecting the ‘Previous screen’ radio button.
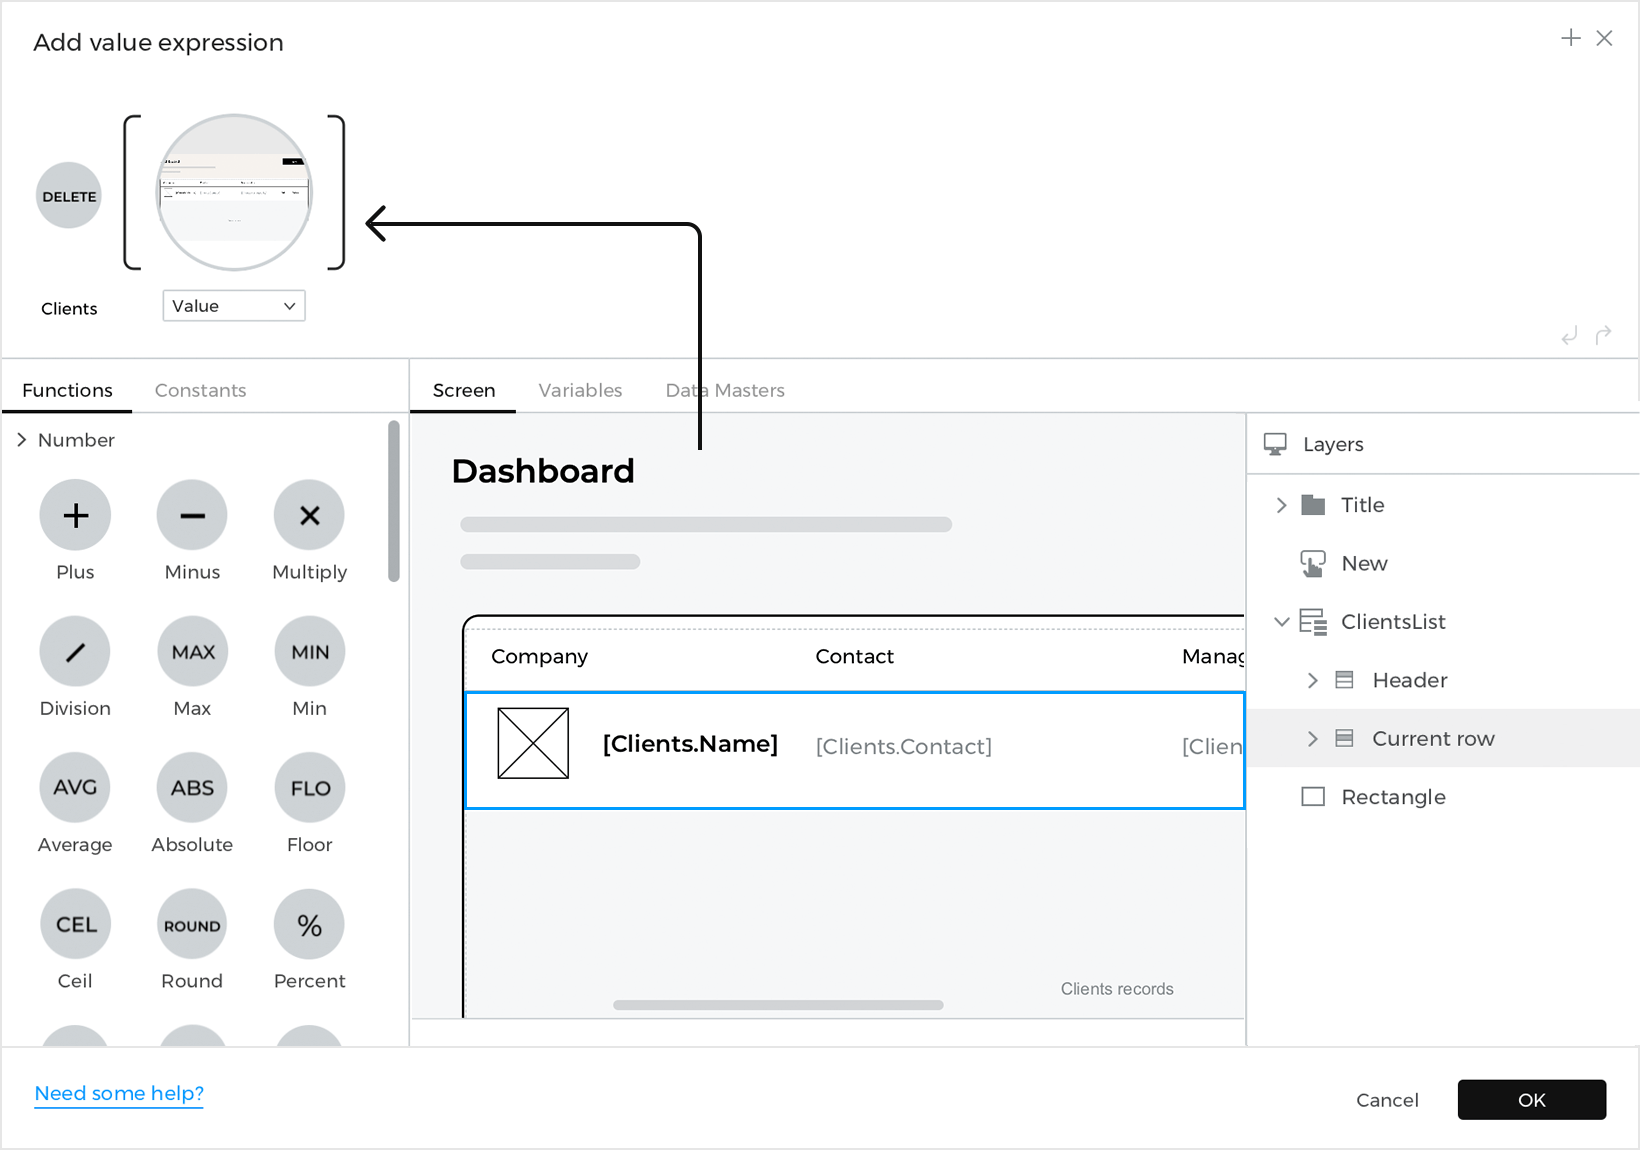
- Repeat steps 2 – 5 on the List Dashboard screen, dragging the current row into the open space in the expression when you’re setting the value to the SelectedRow variable.
Click the ‘Play’ button to simulate your prototype. Click the “Edit” button on one of the rows, which will link you to the Edit Client screen. Enter some information in the form and click “Modify”. You’ll see the edited client information in the card.
Delete data
Next, you’ll learn how to remove client records.
- Go to the Card Dashboard screen. Select the “Delete” button that you added into the grid cell earlier.Create an On Click + Data Master Action – Delete event. You’ll see the Value Expression builder appear.
- Take a closer look at the expression and you’ll see one open space. This is where you’ll specify the row that will be deleted from the Data Master.Drag the grid cell into the open space in the expression. It might be easier to select it from the dialog layers.

Because of the special functionality of the grid cell (and the current row) the Data Master Action will only delete the row where you click the “Delete” button. - Repeat steps 1 and 2 on the List Dashboard screen, dragging the current row of the data list into the open space in the expression this time.


Last steps
You’re almost done! You just need some way to switch between the Card and List Dashboard screens so you can see how your changes are maintained across screens.
- Place two Images I on the Card Dashboard screen. One will represent the Card Dashboard screen, and the other the List Dashboard screen.
- Create an On Click + Navigate To event on the image for the List Dashboard and link to the List Dashboard screen.
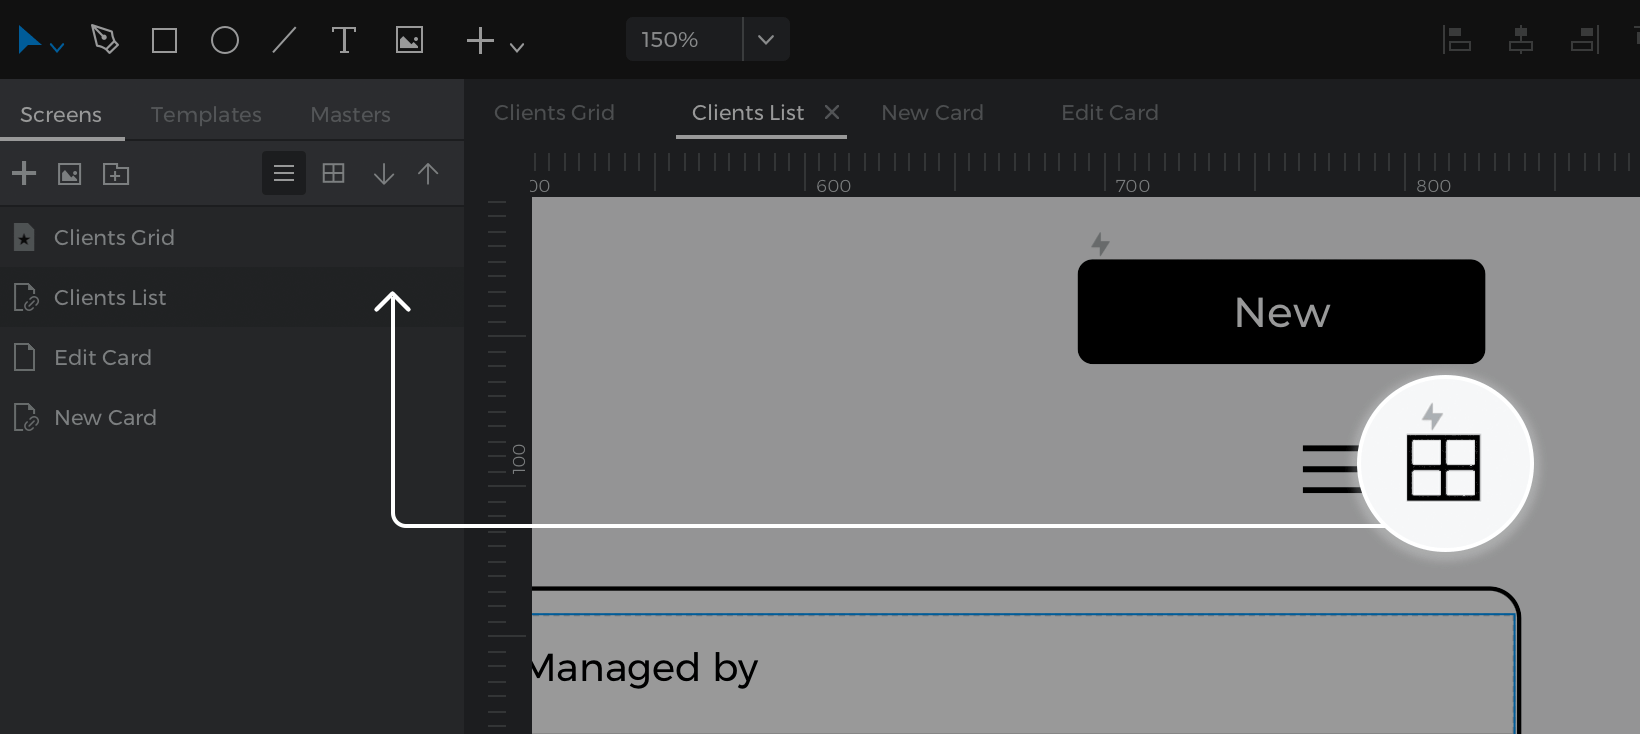

- Repeat the steps above on the List Dashboard screen, linking the image for the Card Dashboard to the Card Dashboard screen.

That’s it! Click the ‘Play’ button to simulate your prototype and see how you can edit, add, and delete client records.