How to debug your Plugin’s code
You can debug your plugin’s code in order to fix possible bugs and see the execution of it line by line. First we need to configure the Justinmind application to run so it can be debug.
Configure your Justinmind application
Find the file called ‘Justinmind.cfg’ inside your Justinmind installation folder (note that we mean the Justinmind application, not the SDK in this case). In Mac, right/option click on the Justinmind app and select ‘Show package contents’. The file is inside one of the folders.
Add the following line under [JVMOptions]
-agentlib:jdwp=transport=dt_socket,address=9000,server=y,suspend=n
Set up your Justinmind SDK
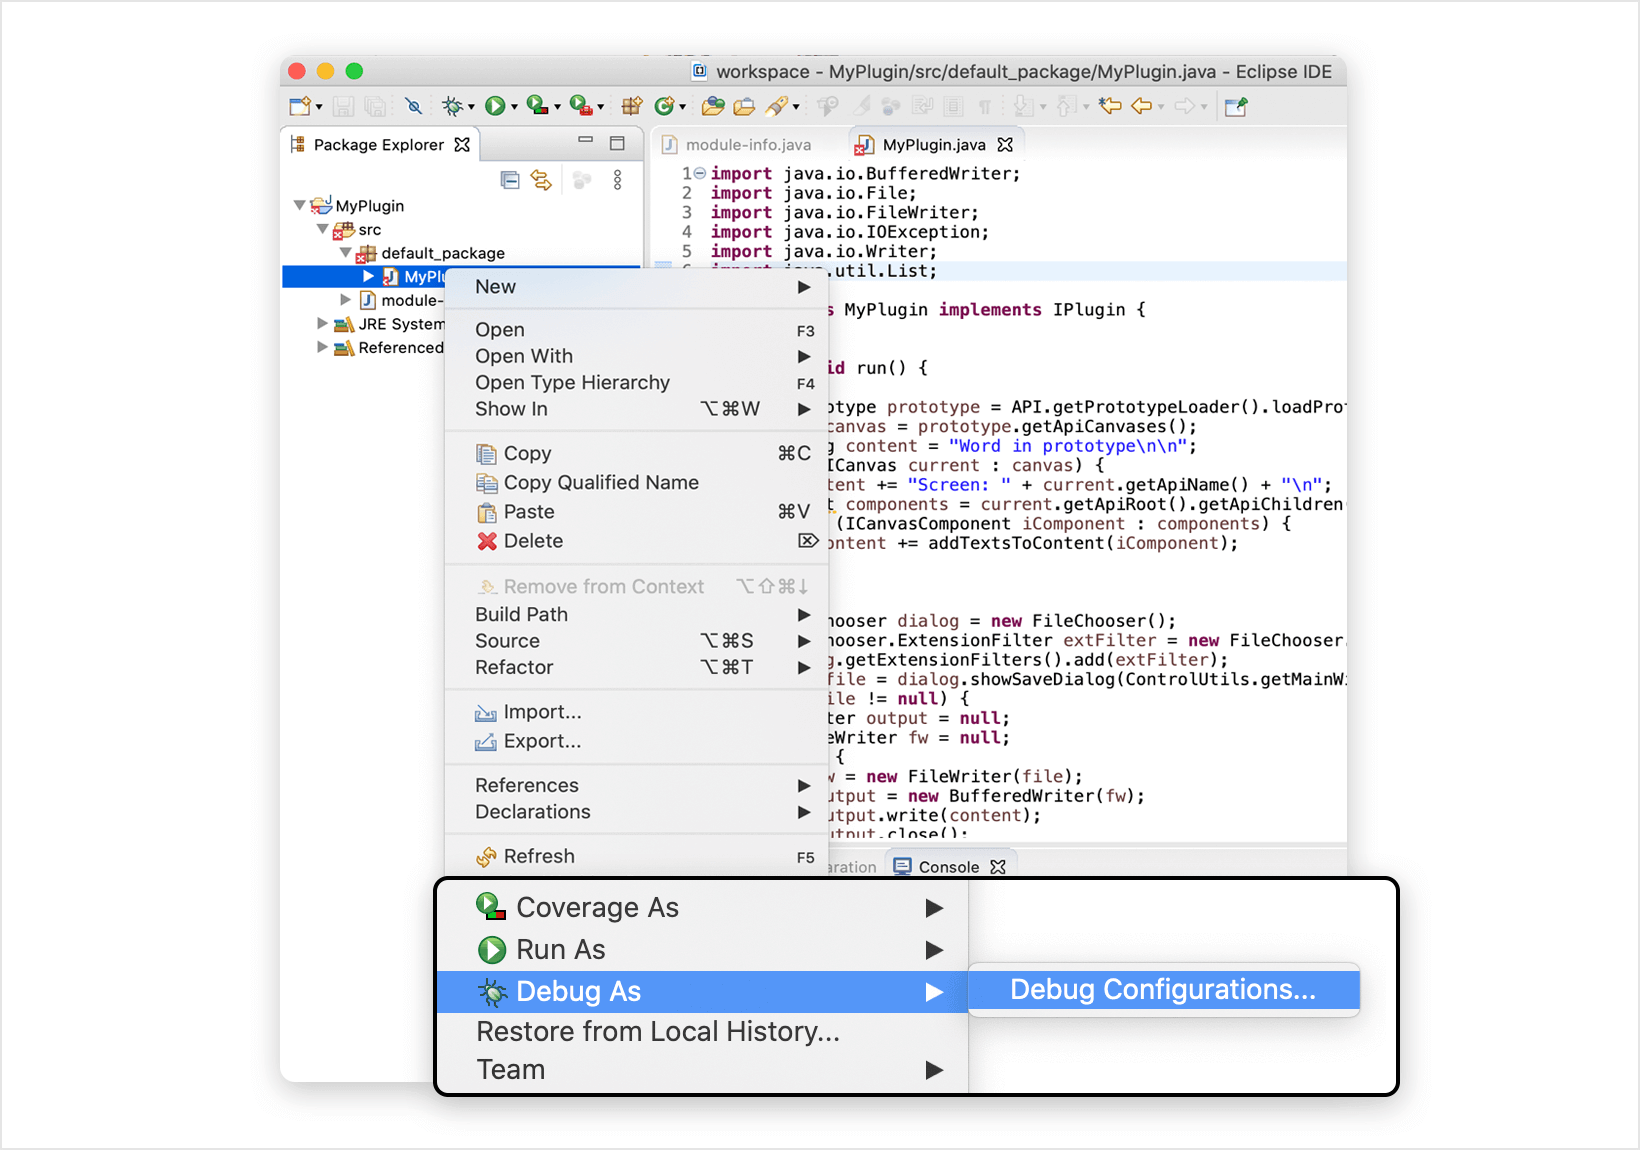
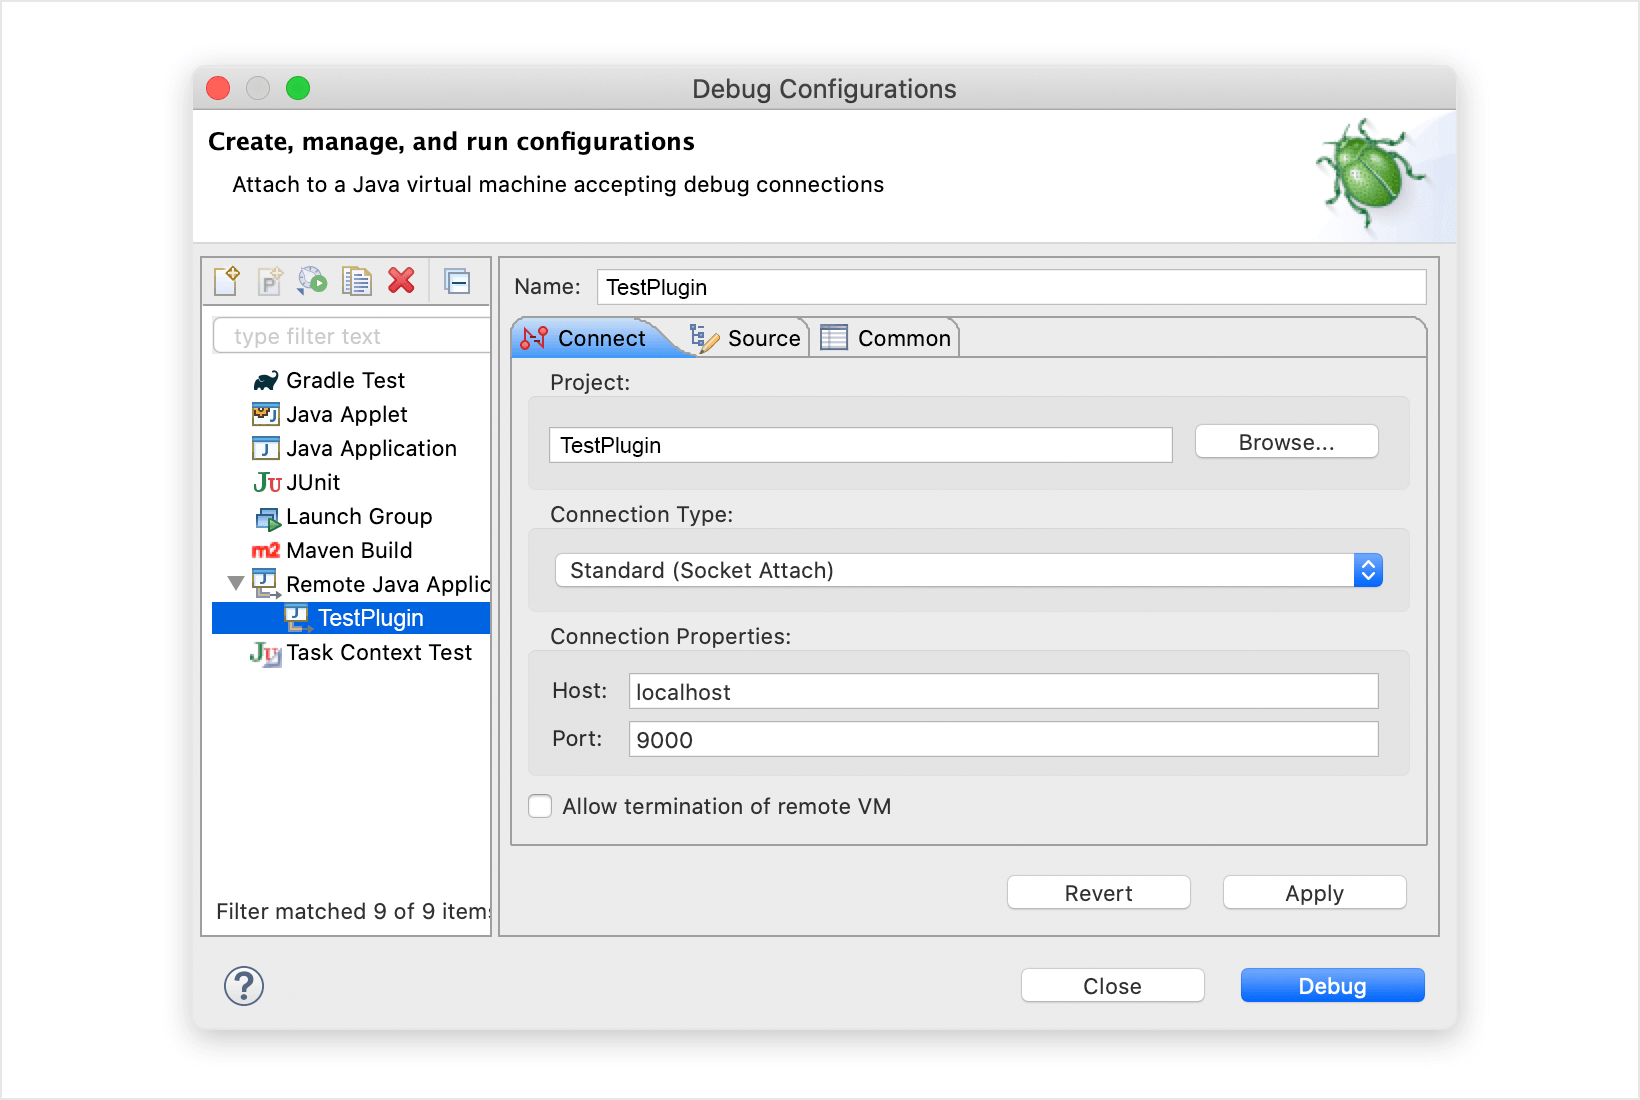
Open your Justinmind SDK and edit your project Debug configuration as follows:


Debugging your plugin
- Open the Justinmind application.
- Set up the desired breakpoints in your plugin’s code in Justinmind SDK.
- Run your plugin project using the debug configuration in Justinmind SDK.