
NASA UXer, Dave Luetger, joined us to discuss the role that qualitative data plays in software design and how his team implements it.
Dave Luetger joined us in San Francisco for what was to be our second UX talk from the NASA design team. He works for the San José State University Research Foundation (SJSURF), something he quipped was a bit of a mouthful.
Dave comes from a background of sociology and human interaction design and works for an internal consultancy model with a team of over 30 comprising designers, developers, and QA managers. Dave’s agency works in various areas throughout the country, though their main station is at the AMES Research Center which focuses on aviation and biosciences.
The meat of Dave’s talk was to inform us specifically about how he and his design team apply qualitative data to their design process at NASA and the beneficial impacts it can have on the outcome of their designs.
Dave kicked off the talk by showing a funny slide of a Photoshopped image of himself in a spacesuit as an astronaut on the moon. He joked that while most people, when thinking about what it must be like to be a UX designer in NASA, might think of astronauts and space, the reality is actually quite different (but no less cool, in our opinion).

He quickly moved on to the next slide where he showed us a picture of a gargantuan spreadsheet with various intimidating combinations of row and column data. “This is what it really looks like…spreadsheets and enterprise software…”, he said, much to the amusement of our audience.
If that wasn’t obvious enough to set the tone for the rest of the talk, the next slide was: “There’s a lot of paperwork to go to space”!
Live from San Francisco with NASA!
Posted by Justinmind Prototyping Tool on Wednesday, May 29, 2019
In a nutshell, Dave and his team’s job is to help NASA do their job of launching rockets and sending people into space, something which requires thorough procedures and lots of bureaucracy. In essence, Dave’s team not only helps make this easier for NASA employees to achieve, they also help speed up the process.
The groups that Dave and his team support within NASA are generally part of ISS and launch ops, providing them with backend enterprise software solutions.
To illustrate this, his next slide treated us to a quadruple collage showing astronaut Peggy Whitson in the upper left quadrant and the control room at Houston on the right. The bottom images showed a space flight launchpad and a massive plasma cannon called the arc jet that blasts plasma at a piece of material to test its durability for atmospheric re-entry.
Of the centers mentioned above, the one Dave and his team mainly work with is the Space Launch System (SLS). What’s the SLS? Basically, when NASA stopped using their old space shuttle, they created the SLS to go to space. The most complex vehicle built to date, the SLS comprises of a core stage (where the astronauts sit), large engines at the bottom and boosters – unfortunately there’s not enough room in this post to get more technical than that!

The SLS is a great example of some of the groups that require Dave and his team’s help. Various teams and contractors worked on designing and building the rocket. To be able to assemble it successfully, several factors had to come together – all of the parties mentioned above had to send each other a multitude of documents, including but not limited to:
- Schematics
- Drawings
- Math models
- Trajectories
- Environments
For example, let’s say a mechanic is working on boosters. They might need to know about the conditions of a certain part of the atmosphere. In that case, it’s the environmental engineer’s job to calculate it, so he’ll prepare it and send it to the mechanic. To do that, he has to get hold of the mechanic’s data.
This need leads on to the data exchange process. To exchange data within the organization, one team usually hands a lot of paper over to the other. For example, the Engines Department might hand over a folder of completed documentation to the Booster team which consists of a model drawing, complete with analysis and data, along with a memo that serves as a cover sheet.
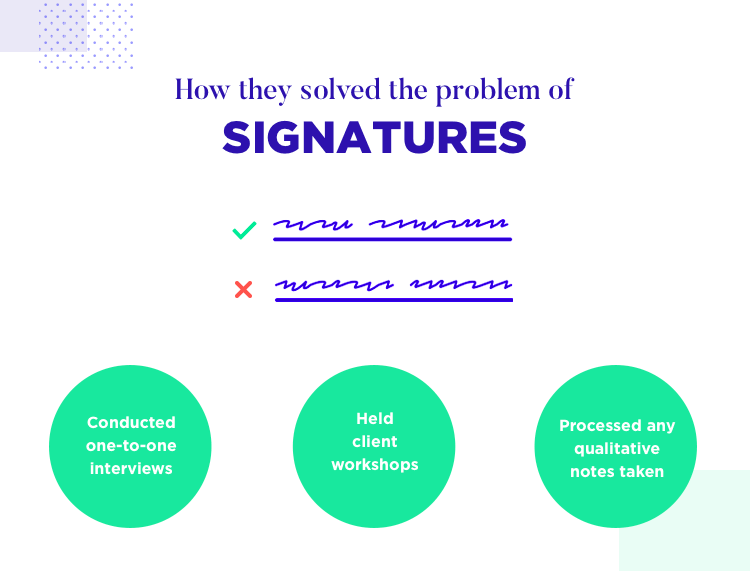
The latter document is the example that Dave focused on in this talk. This memo sheet normally requires two signatures – in this case, from both departments. However, a procedure like this doesn’t come without its issues.
There can often be large delays in producing and completing projects such as the one mentioned above due to paperwork not being delivered on time or someone running about the building trying to find the right person to sign off on documents such as the memo sheet.
Dave recounted a case of one NASA employee who told him that after ages searching for someone to sign the memo with a wet signature, it turned out she’d actually gotten the wrong employee, resulting in her having to redraft the memo. This is an example of a problem that Dave and his team set about fixing. Now comes the exciting part – how did they go about it?
The fact that all these documents required signatures arose from an internal NASA process stipulating that the appropriate person had to sign off on inter departmental documents being passed around. One person was in charge of monitoring the entire process on a spreadsheet – the intimidating one Dave showed at the start of his presentation!
As you can probably guess, the fact that Dave and his team were called in to work on a software solution to improve the process meant that something was wrong. And indeed it was – as he reported, the people in charge of this spreadsheet and of monitoring the entire process were stretched out and, in the end, much of the data didn’t end up ever being recorded. Many employees were stressed to the brim of trying to get wet signatures for everything.
The interviews Dave and his team conduct are never recorded in the traditional UX way, that is, by recording a video. Instead, his team has an efficient note-taker. The reason for this, Dave explains, is that the people at NASA, don’t enjoy being filmed, but also, and mainly because, people are less likely to be fully honest when they’re aware they’re being recorded.
So that begs the question – how do they sort through all the notes gathered from these user sessions? Dave informed us that he and his team structured and quantified these findings to come up with a solution. This in turn helped build trust with the client. After all, NASA employees are usually scientifically minded people.
They also approach this part in a slightly non-traditional UX way. Dave confesses that to him, plastering the wall with sticky notes doesn’t always cut the mustard. He prefers to draw a straight line from A to B and feels that sometimes, the simple act of basing product decisions on evidence gathered can get a bit lost with the sticky note technique.
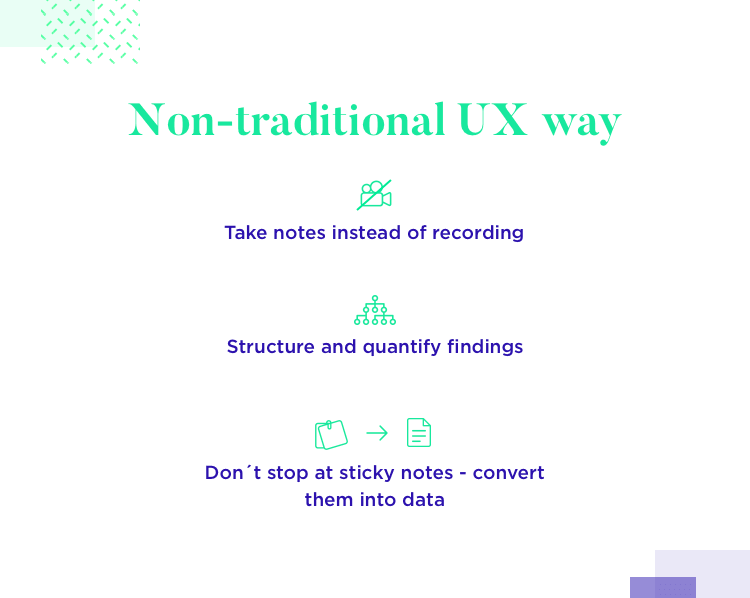
Mostly, Dave and his team prefer to turn the notes they gathered into data, which lead to opportunities, which in turn lead to action.
“Each note captures one key point from the interview and is self-contained - it can be understood without reference to the notes on either side.”
To solve the wet signature problem, he and his team took a trip over to the Marshall Flight Center in Alabama, one of the three biggest NASA centers, where most of the SLS work happens.
They then conducted the interviews with a two-partner approach, one person facilitating the interview and thinking about the next steps while the other jotted down exhaustive and thorough notes. Dave emphasizes again that note-taking is critical to their process due to the possibility to transform them into “nuggets”.
“[Nuggets are] the atomic unit of a research insight.”
Quoting Holtzblatt and Beyer in Contextual Design, Dave stressed the importance of notes being able to stand alone independently from the rest: “Each note captures one key point from the interview and is self-contained – it can be understood without reference to the notes on either side.”
He topped that off with a quote from Tomer Sharon, head of user research at Goldman Sachs and previously a UX researcher at Google, explaining that these nuggets represent “the atomic unit of a research insight.” Nuggets are basically stand-alone notes that you can take at face value and that don’t depend on any others. These nuggets can be archived and saved for later.
We can sum up Dave and his team’s data gathering process in three steps:
- Gather raw notes
- Convert raw notes to nuggets
- Convert nuggets to “themes”
In this case, they had many raw notes detailing the problems their clients had gathering signatures which they then condensed into a nugget a few lines long that could stand alone. They converted this nugget into a generally recurring theme present in all the interviews – the fact that most people spent “a lot of time chasing signatures.”
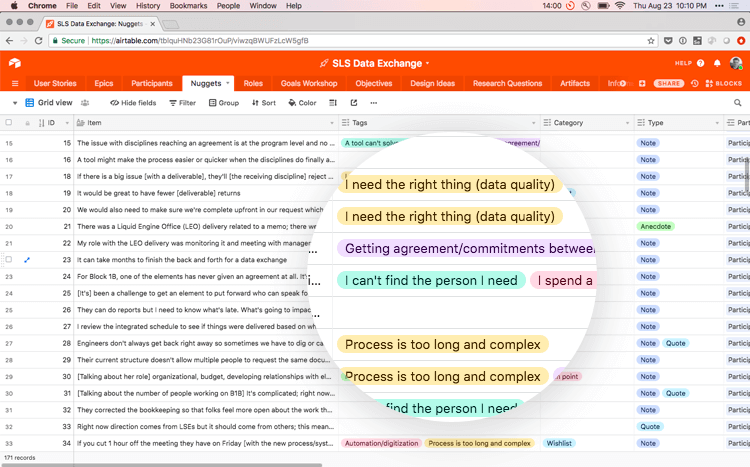
Dave then introduced a piece of software he uses called Airtable. This is where he organizes all his nuggets. In Airtable, they assign one or more “theme tags” to each nugget, which come in different colors. But how did they prioritize their findings?
The way they prioritize the themes is to gather all the theme tags and order them by frequency. He displayed a nice bar chart with all the different tags at various sizes to represent the frequency of each and compare them with each other. However, this still didn’t solve the problem of how often these things were actually mentioned in interviews.
That was solved with what he called a prevalence / severity matrix which answered the question of how often each theme occured vs how bad it was. In the case of the wet signatures, it turned out that it was mid-prevalence but still somewhat severe, as it meant people weren’t getting stuff delivered on time. Dave and his team went to work on it immediately.

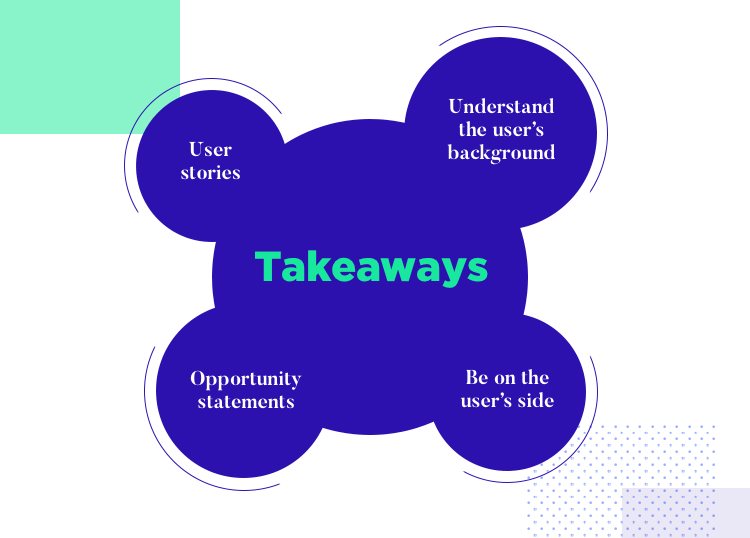
It was then time for Dave and his team to create “opportunity statements”. These statements frame a problem in a way that’s easier for both the clients and the design team to understand. At the end of the day, the client has time limitations and they prefer it when things are concise and to the point.
Then it’s a case of making a decision about the new product and examining the opportunity statement one last time to ask themselves “does it help us address this opportunity – are we going in the right direction?”
There’s a fine and subtle line between presenting the client with a list of problems dragging them down or presenting them with a list of opportunities – and it’s the latter that Dave and his team normally choose to do. Hence, the opportunity statement produced from the theme “I spend a lot of time chasing signatures” was “There is an opportunity to reduce the time required for sign off.”
In fact, in this project there were four other opportunity statements:
- Make it easier to find and access material
- Find the right people more quickly
- More effectively communicate data relationships
- Keep the conversation unified
The key here is in translating these statements into a something that makes sense for the user. Dave and his team convert opportunity statements to user stories using the following formula:
As a type of user, I want to do an action so I can achieve some outcome.
In this case, there were three types of people who were typically responsible for a document being signed:
- Data user: this is the person requesting the signature
- Approver: this is the person who signs off on the memo
- Scheduler: moves a project forward once all signatures are acquired
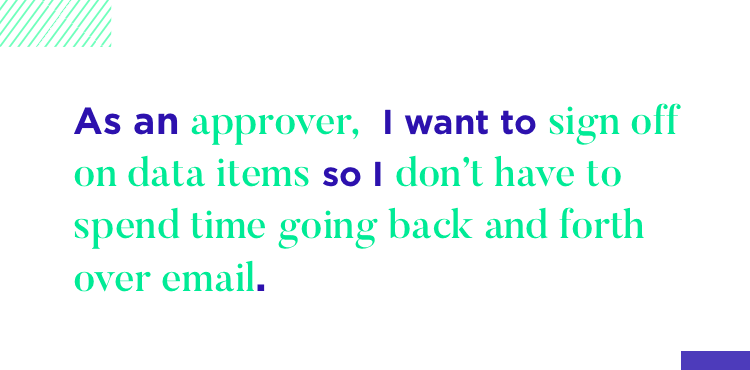
Dave and his team then converted each statement into a user story in the following way:
- As an approver, I want to sign off on data items from a central location so I don’t have to spend time going back and forth over email.
- As a data user, I want to request a digital approval so I can save time on gathering wet signatures.
- As a scheduler, I want to see all signatures in one document so I understand whether a delivery is ready to move forward.
Using Airtable, Dave was able to create a formula where a person with a certain role was linked to a role spreadsheet, along with what they wanted to achieve and link each piece of research to the participant it came from. The team then ended up with a huge research document that had everything linked together.
Keeping everything together in this way was helpful because, if someone had a question about why a certain proposition was made, they could literally trace it back to the individual participants who mentioned it.
Dave’s agency’s flagship product is the Mission Assurance System (MAS). MAS is basically a type of Salesforce software that’s used for internal NASA applications. MAS is broken down into different sections. One of them, Data Exchange (DEx), is the product resulting from the need to gather signatures.
DEx helps fulfil needs like search through records, linking together different dependencies and filling out forms digitally to avoid having to do it with memos.
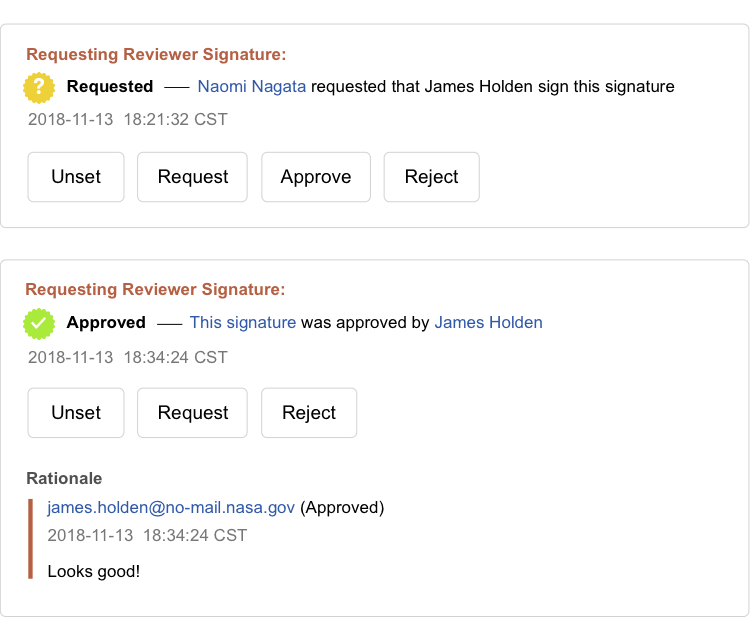
DEx does this with the Reviewer Signature feature whereby, a request to sign a digital document can be sent by a data user to an approver who just has to use his or her NASA badge to sign it.
Dave defended his team’s nugget idea by maintaining that they helped both them and their clients agree on one common reality. He emphasized the power of opportunity statements to help identify and communicate a problem and insisted that user stories help a team to take “measurable action”.
There’s never a right or wrong way to go about the UX design process and it will always depend on the type of client you’re designing for. However, Dave’s story shows that he and his team not only managed to find the right solutions for backend software development at NASA, but that their chosen methods worked exceptionally well.
“Designers can design a solution to a problem, but they can’t design a solution to a disagreement”.
Whatever way you go about doing it, one thing is for sure: being on your user’s side and understanding where they’re coming from will always help you develop better solutions. It’s a UXer’s job to empathize.
Dave emphasized during his presentation that his team didn’t just waltz in and start telling everyone how to do their job but instead listened to their problems and became allies. Instead of dictating the process, they got people involved early on in the design process which is the key to great UX. Dave and his team’s success in UX can be further echoed through a quote taken from one of the SLS engineers: “We like having you on the phone for emotional support.”
However, while UXers like Dave are there to listen to people’s problems and make their working life easier, they can’t solve their clients’ lives. To re enforce this he used a quote from Mike Monteiro’s book, You’re My Favorite Client: “Designers can design a solution to a problem, but they can’t design a solution to a disagreement”.
Dave and his team could improve the usability of NASA software and help make processes easier for NASA employees, but they emphasize that they can’t provide a solution to professional disagreements or to office politics. In this sense, he conveys that UX at NASA is very much about coming up with practical solutions to complex problems, but that it is wholly impersonal and based on facts.
PROTOTYPE · COMMUNICATE · VALIDATE
ALL-IN-ONE PROTOTYPING TOOL FOR WEB AND MOBILE APPS
Related Content
 Learn how to design better e-learning platforms with user-centered UX principles, real examples, and high-fidelity prototyping tips to boost engagement and learning outcomes.13 min Read
 Infinite scroll keeps users engaged, but it’s not always the best choice. This guide breaks down when to use it, when to avoid it, and how to design it right.14 min Read
 Learn how to design web and mobile app prototypes, how to test them and what to look for in a prototyping tool in this complete guide.15 min Read


