Data lists
The Data List widget displays Data master records in a list / table format.
Upon creating your Data list, the top-left cell will display with your Data master field names. The additional cells will be displayed with a gray fill. When you simulate your prototype, the additional cells will be filled with your Data master records.
Displaying Data master records in a Data list
Learn how to display Data master records in list form with a Data list in your interactive prototypes.
Let’s do it step by step:
- In a new web prototype, create a new Data master by clicking the ‘+’ icon in the Data masters palette. In the dialog that appears, give your Data Master a name. To match our example, name it “Contacts-list”.
- Add Fields to your Data master by clicking the ‘+’ icon on the right-hand side. To match our example, create the following Fields: Name, Email, Company and Image.
- Change the Type of the Image Field to “File Upload” and click “OK”.
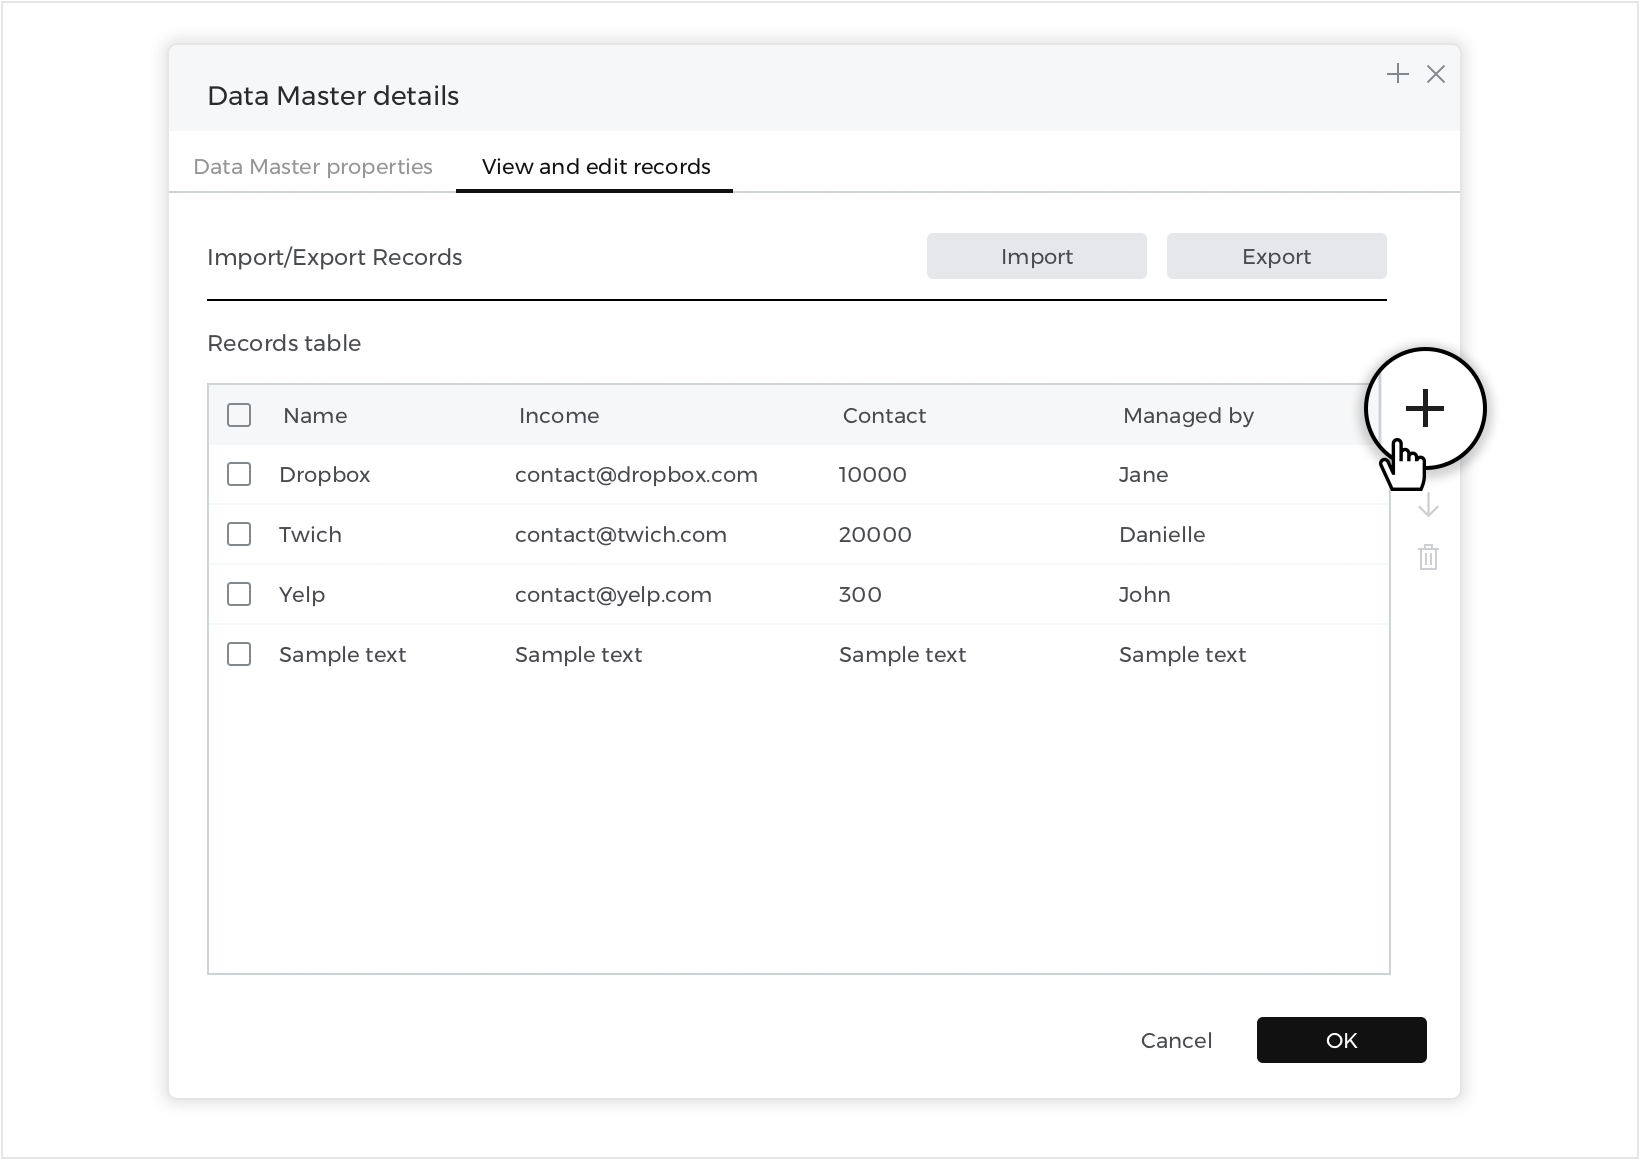
- Back in the Data Masters palette, right click on your Data Master and select the View and Edit records tab in the dialog that appears. Create data Records, giving each a name, email, company and image. Click “OK”.

- Next, go to Toolbar – Plus icon – Dynamic Content – click on ‘Data List’.In the dialog that appears, give your Data List a name (“Contacts List” to match our example). Select your Data Master from the “Data Masters” drop-down.We want to include all Data Master Fields in the Data List. To move them all into the selection box, click the right double line arrow icon.Then, click “OK” and position your Data List in the center of the canvas.On the Canvas, the top-left cell will display sample Field names.
- Click “Simulate” again to simulate your Data List with the real data in place.


Properties
From the Properties palette, you can modify the following properties of your Data List:
- Number of columns
- Number of cells per page
- Orientation – rotate your Data List horizontally or vertically
- Spacing – modify the spacing between cells
Customizing a Data list
With Justinmind, you can customize the appearance of your Data list. Follow the steps below to customize individual columns in your Data list:
- Go to the Properties palette and change the number of columns of the Data list to three.
- Then, from the Layers palette, select the “List cell 1” cell from within the Data list.
- On the canvas, remove the “Name”, “email”, “Company” and “image” Text elements to match our example. Then, distribute the cell’s Input Text Fields and resize the cells to match our example or make it your own.
- Click “Simulate” to view your customized Data list.

Sort columns
Now we’ll learn how to sort columns of a Data List from largest to smallest. This would also work for a Data List, but we’re only adding this to the Data List in this case.
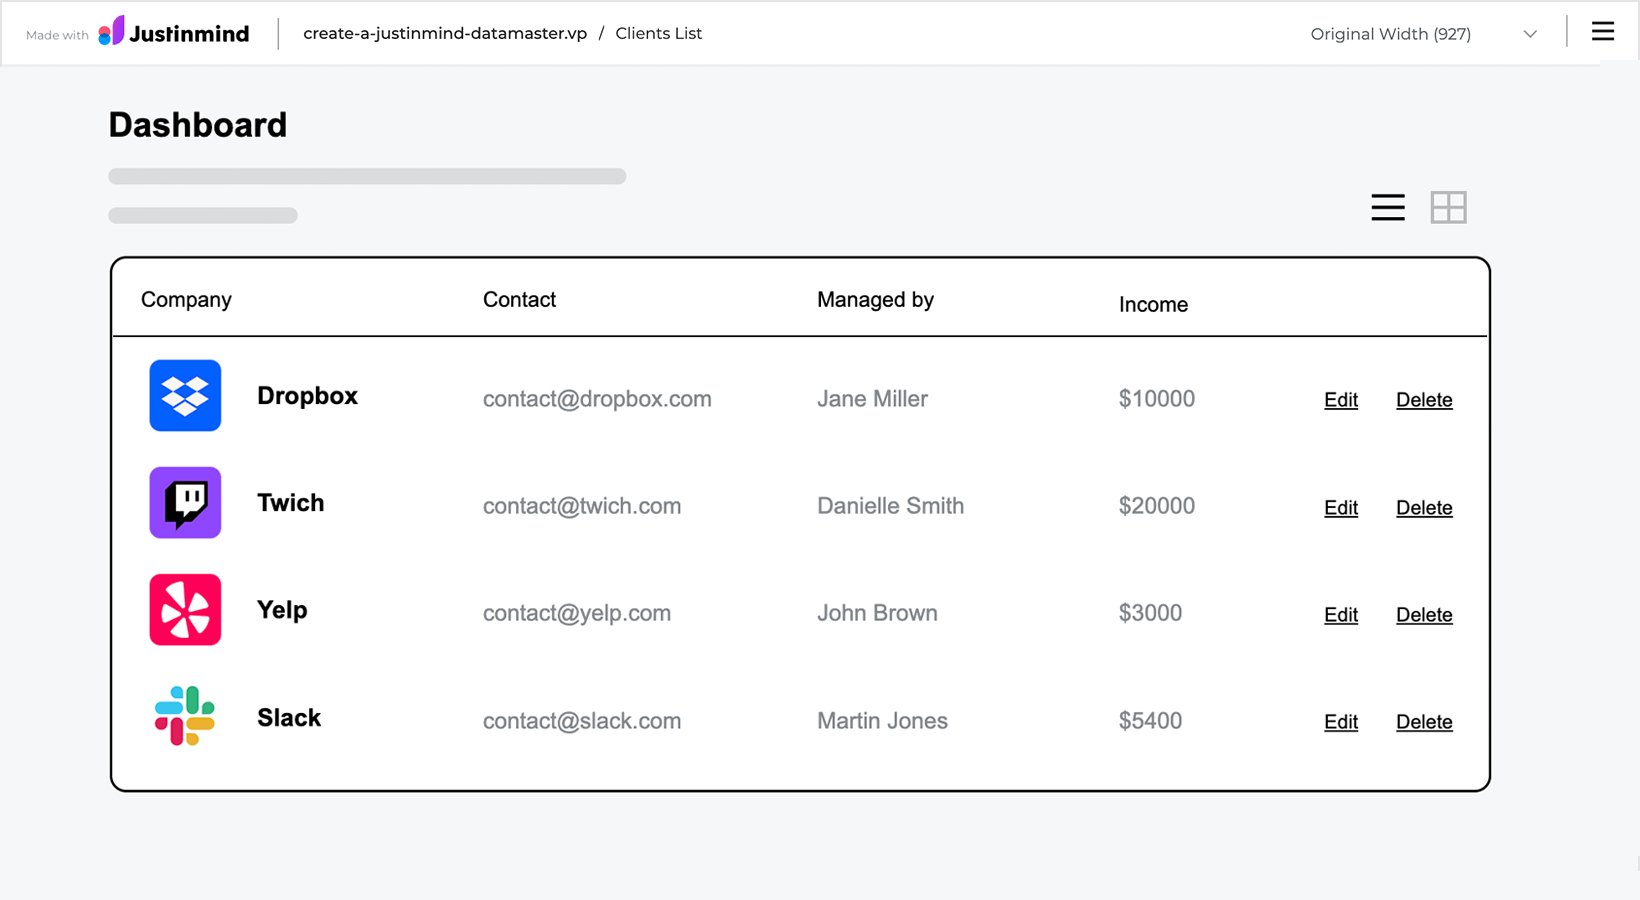
- In the same prototype, navigate to the ‘List Dashboard’ screen. Recall that in the last tutorial, we decided not to include the ‘Income’ field in this Data List. For this example, we’re going to place it back in, and use it to sort the data by income. Right-click on the ‘Clients’ (Data List) and select ‘New Column’.Hover over the column and you’ll see a white ‘arrow’ icon appear. Click and drag the column to the left, so it’s next to the ‘Managed by’ column.Copy the ‘Managed By’ text header and paste it into the new column header, renaming it ‘Income’.Copy the ‘[Clients.Managedby:]’ field in Current_Row_1, and paste it into the new column cell. In the Properties palette, look to the ‘Data Field’ dropdown, and change it to [Clients.Income]. Now, this field will display the data from the ‘Income’ field in our Data Master.Additionally, place a text element next to [Clients.Income] and label it ‘$’.
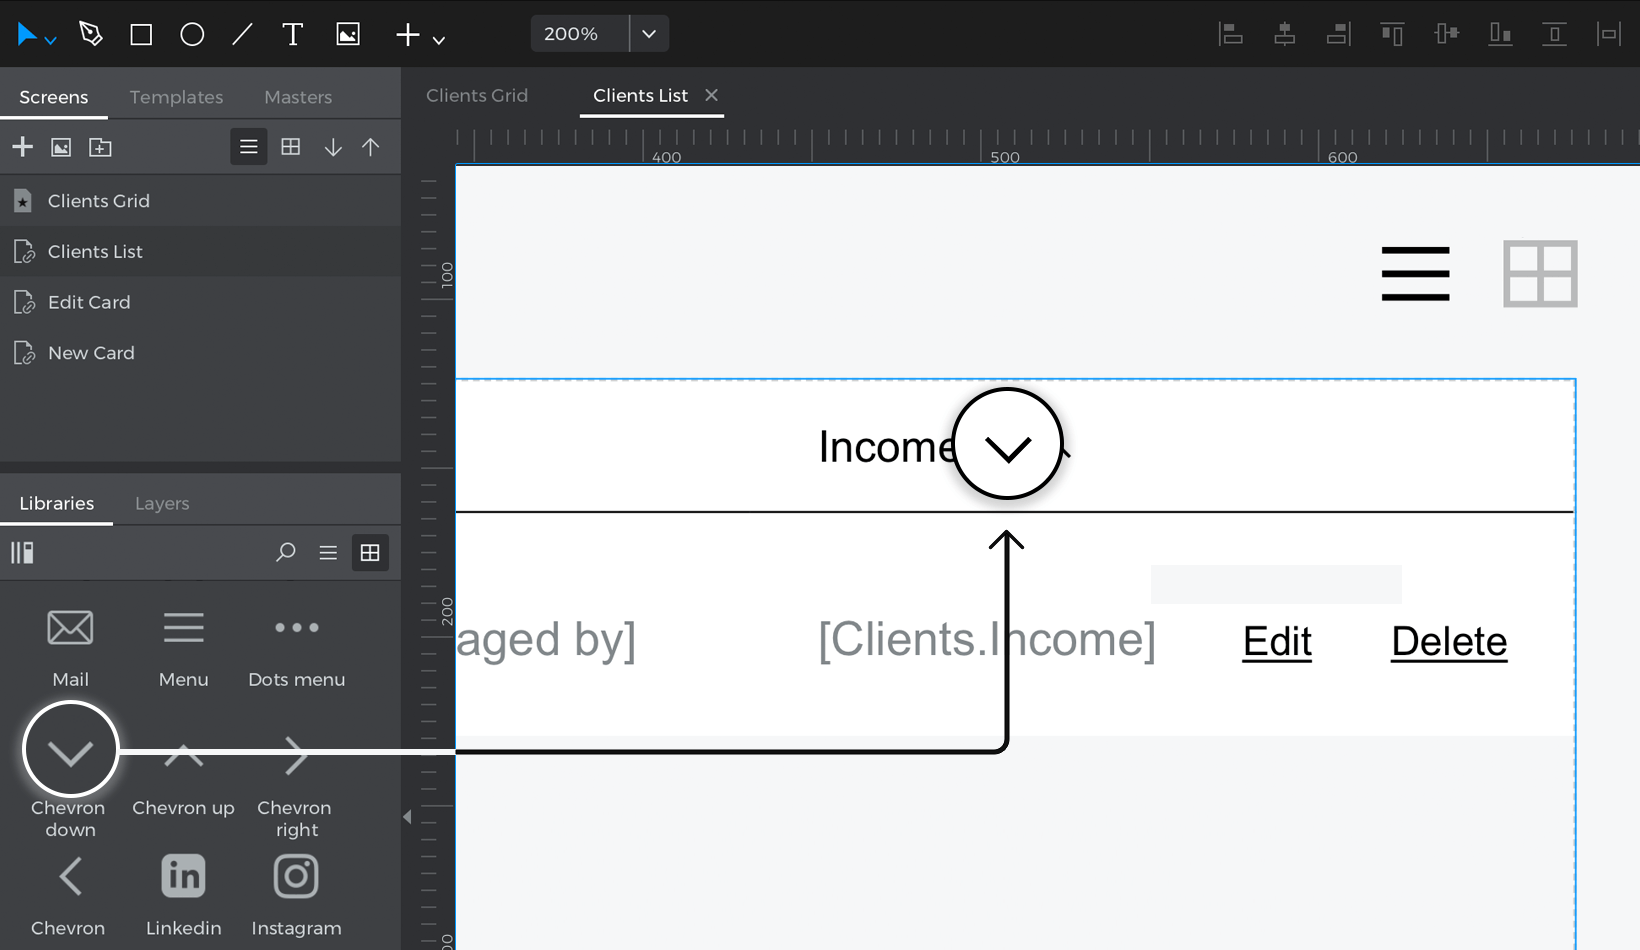
- Drag two ‘arrow’ icons into the header next to ‘Income’. We’ll use these to sort the data from highest to lowest income. Ours are from the ‘Web Components’ widget library, but any kind of icon will work.

- Click on the ‘up’ icon and create an “On Click” + “Set Value” event, selecting the Data List as the target of the action. For the value, click the ‘Calculated’ radio button and the ‘Add expression’ text. You’ll see the Calculated Expression builder appear.
- In the builder, drag the ‘Sort’ function to the open space in the expression, changing the sort direction to ‘descendant’. Drag the Data Master to the first open space on the left. Drag the ‘Income’ attribute to the space on the right.Like the Search filter, the Sort function has a similar structure – the first space defines what we’re going to sort, and the second space defines what parameters we’ll sort by. In this case, we’re sorting by the Income numbers.
- Repeat steps 3 and 4 for the ‘down’ icon, remembering to change the sort direction to ‘Ascendent’.

You can download our example here.
Filter rows
In this example, you will learn how to use the filter function to filter the values in a data list using a select list in the header.
Here’s how you build it:
View
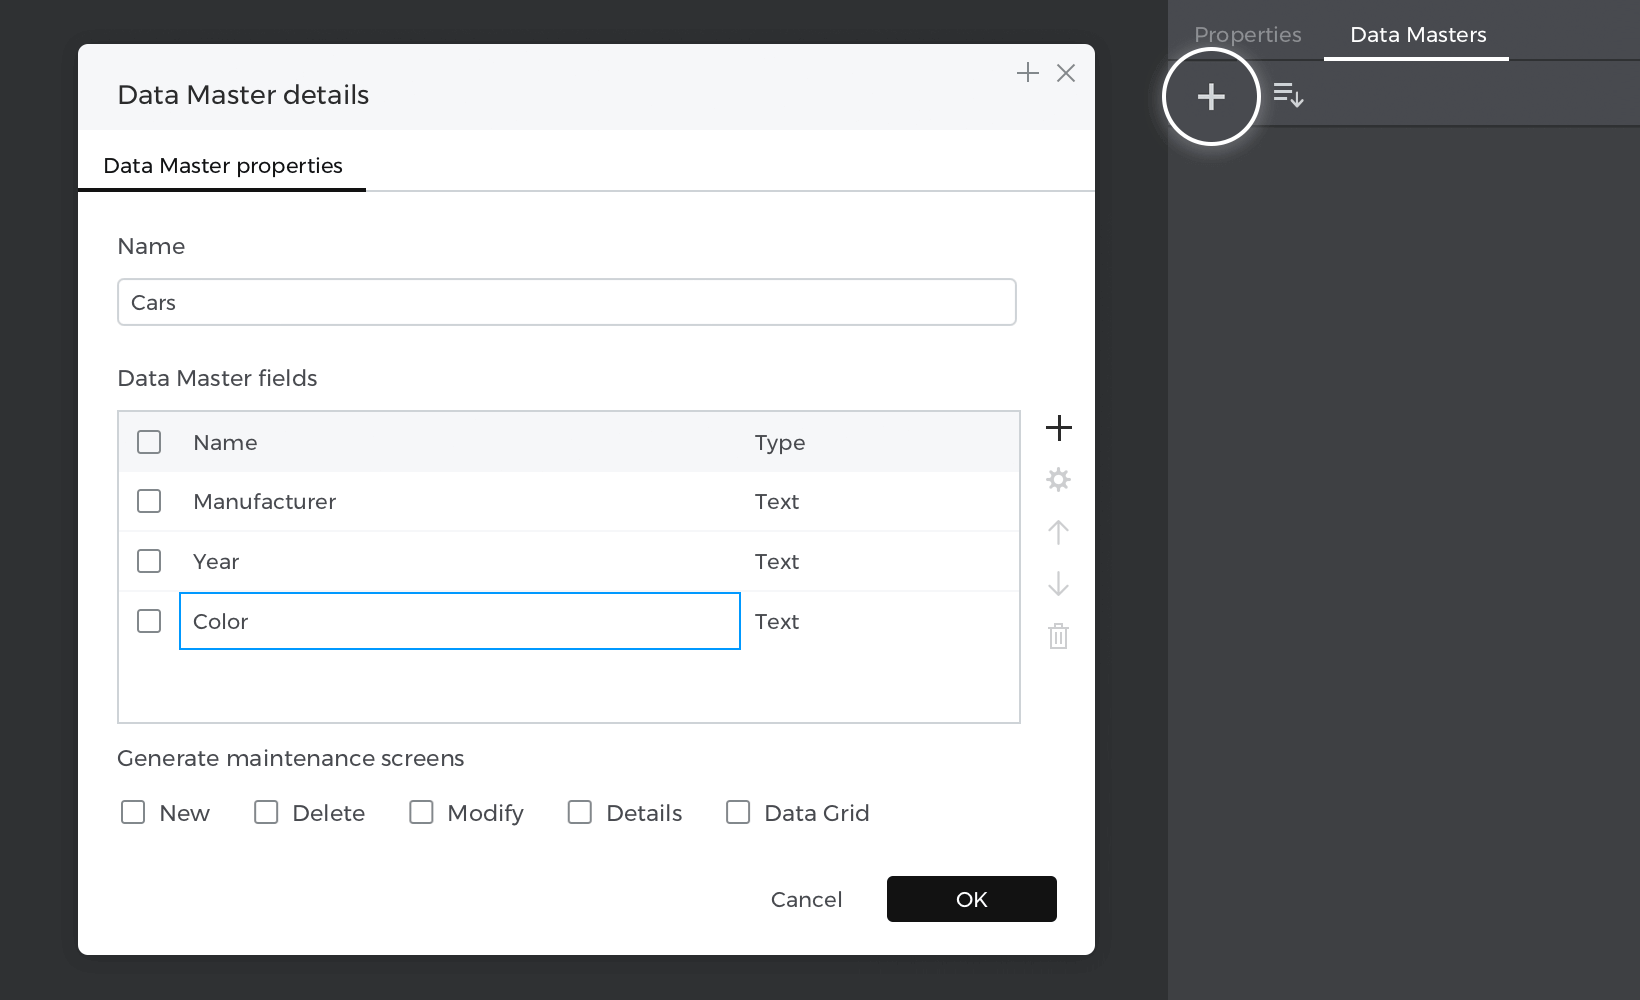
- Go to the Data Masters palette and create a new “Data master”, name it “Cars,” create tree attributes: “Manufacturer”, “Year” and “Color”, then press “Ok”.

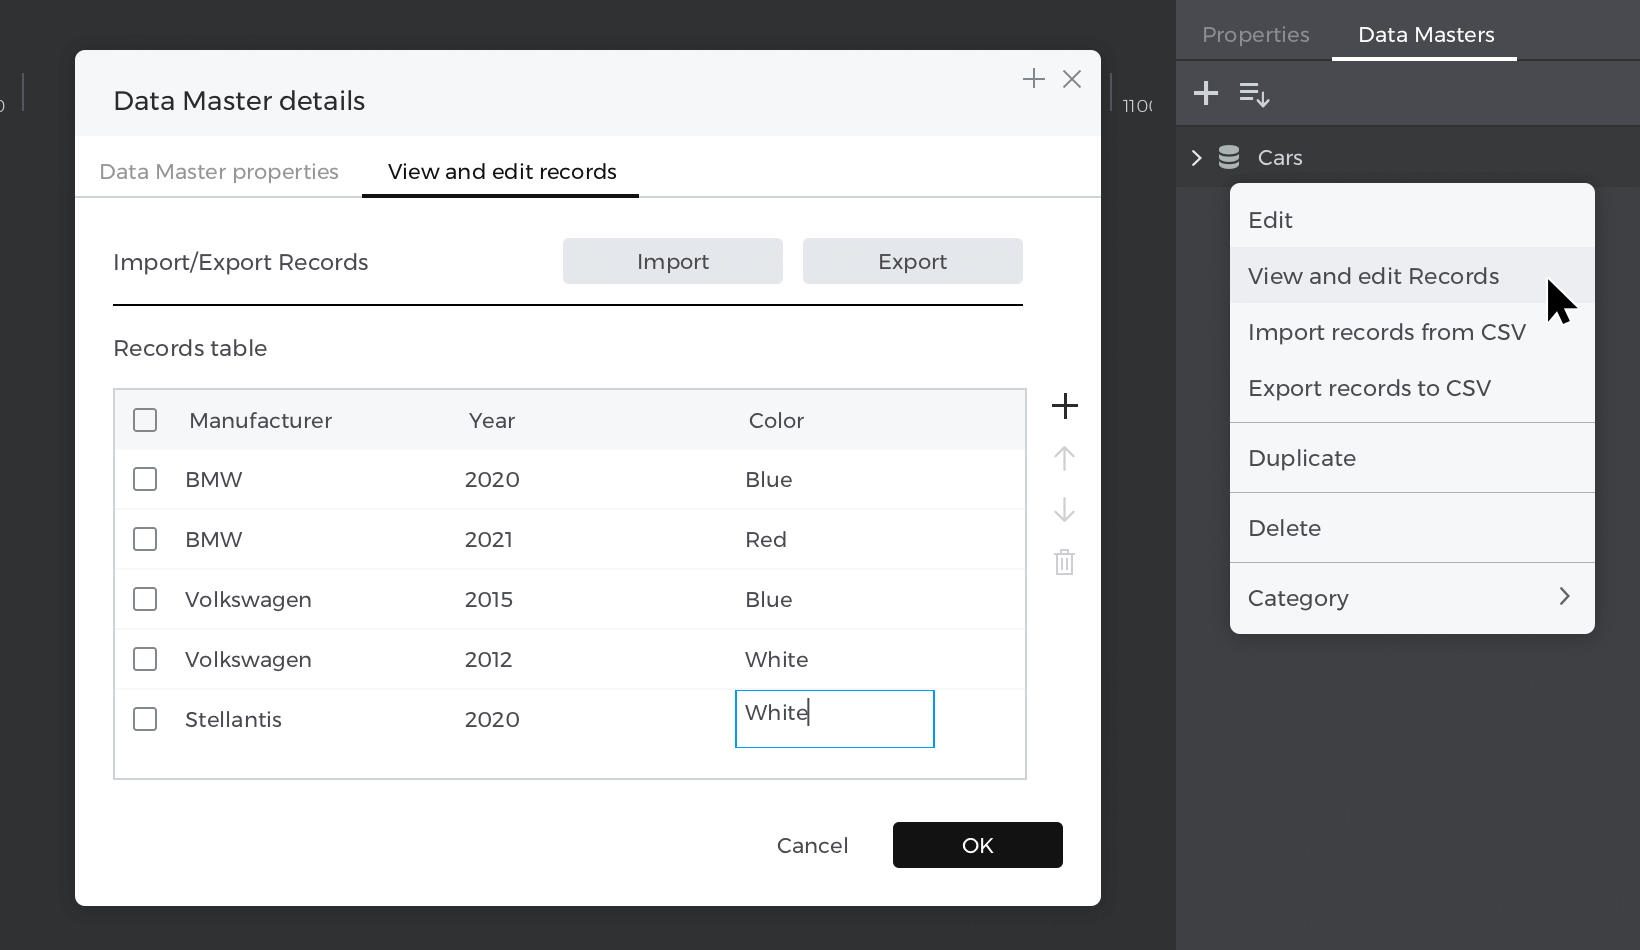
- Right-click on the “Data master” you’ve just created and select “View and edit records,” write your example cars there and then press “Ok”.
- Select “Data list” from the “Dynamic content” section and place it on the canvas; the “New Data List” window will be enabled; give your list a name, next choose the “Data master” you have created before and select all the attributes.


- Place a “Select” from the “Interactive input fields” section inside the header of the column you want to filter; press command (Mac) or control (Windows) while dragging the element inside.
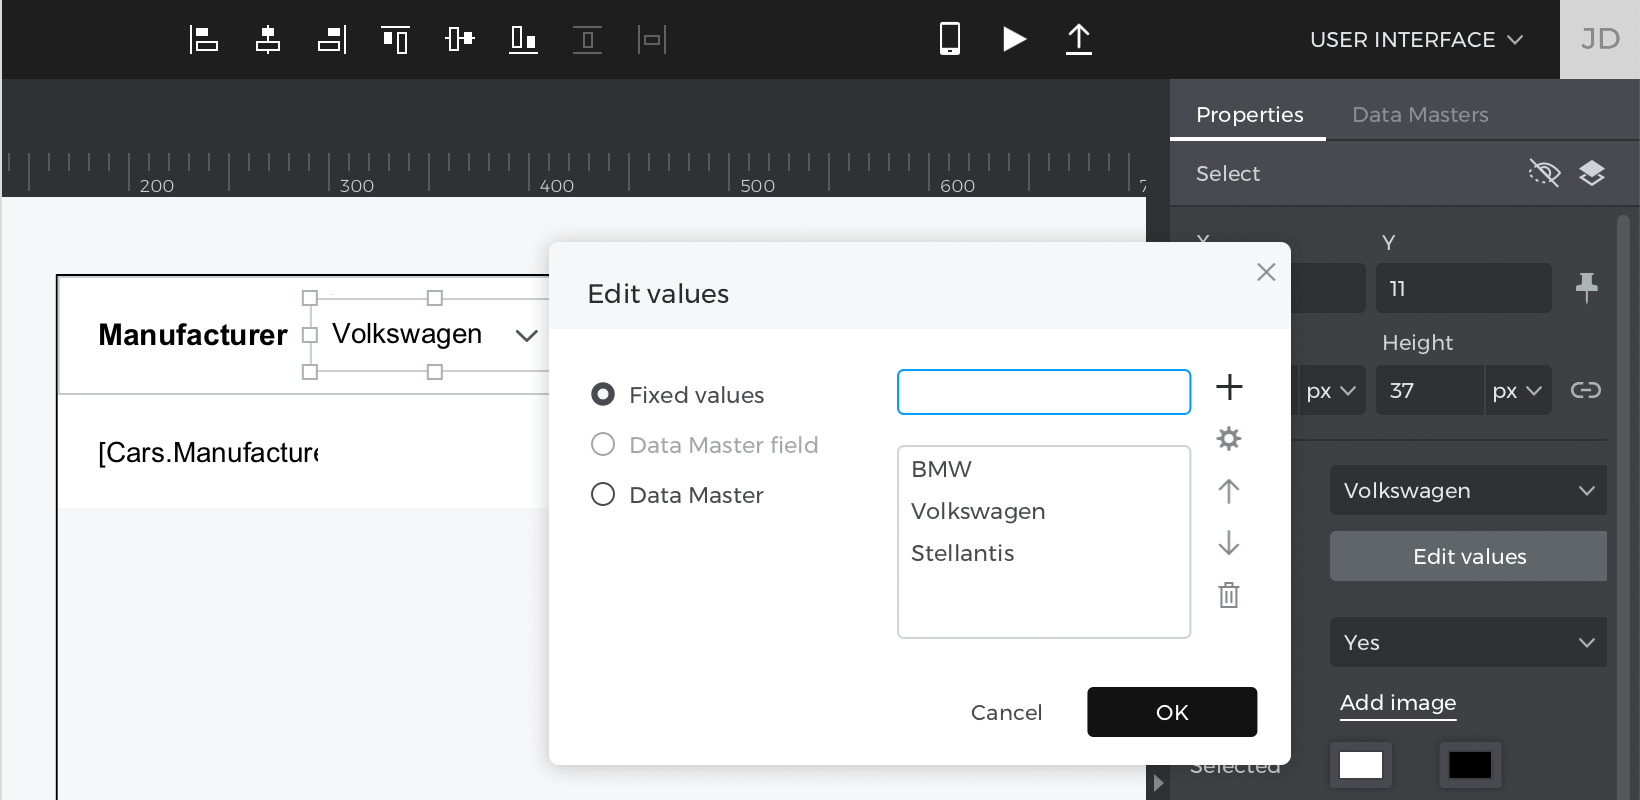
- Click on the “Select” and edit the values from the Properties palette to match the option you have in your column.

Events
With the “Select” selected, go to the Events palette and click “Add Event”.
- Click “Choose Trigger” in the dialog box and select “on Change”.
- In “Choose Action”, select “Set value to an element” and click on the “Data list”.
- Select the “Calculated” radio button for the value and click “Add expression”.
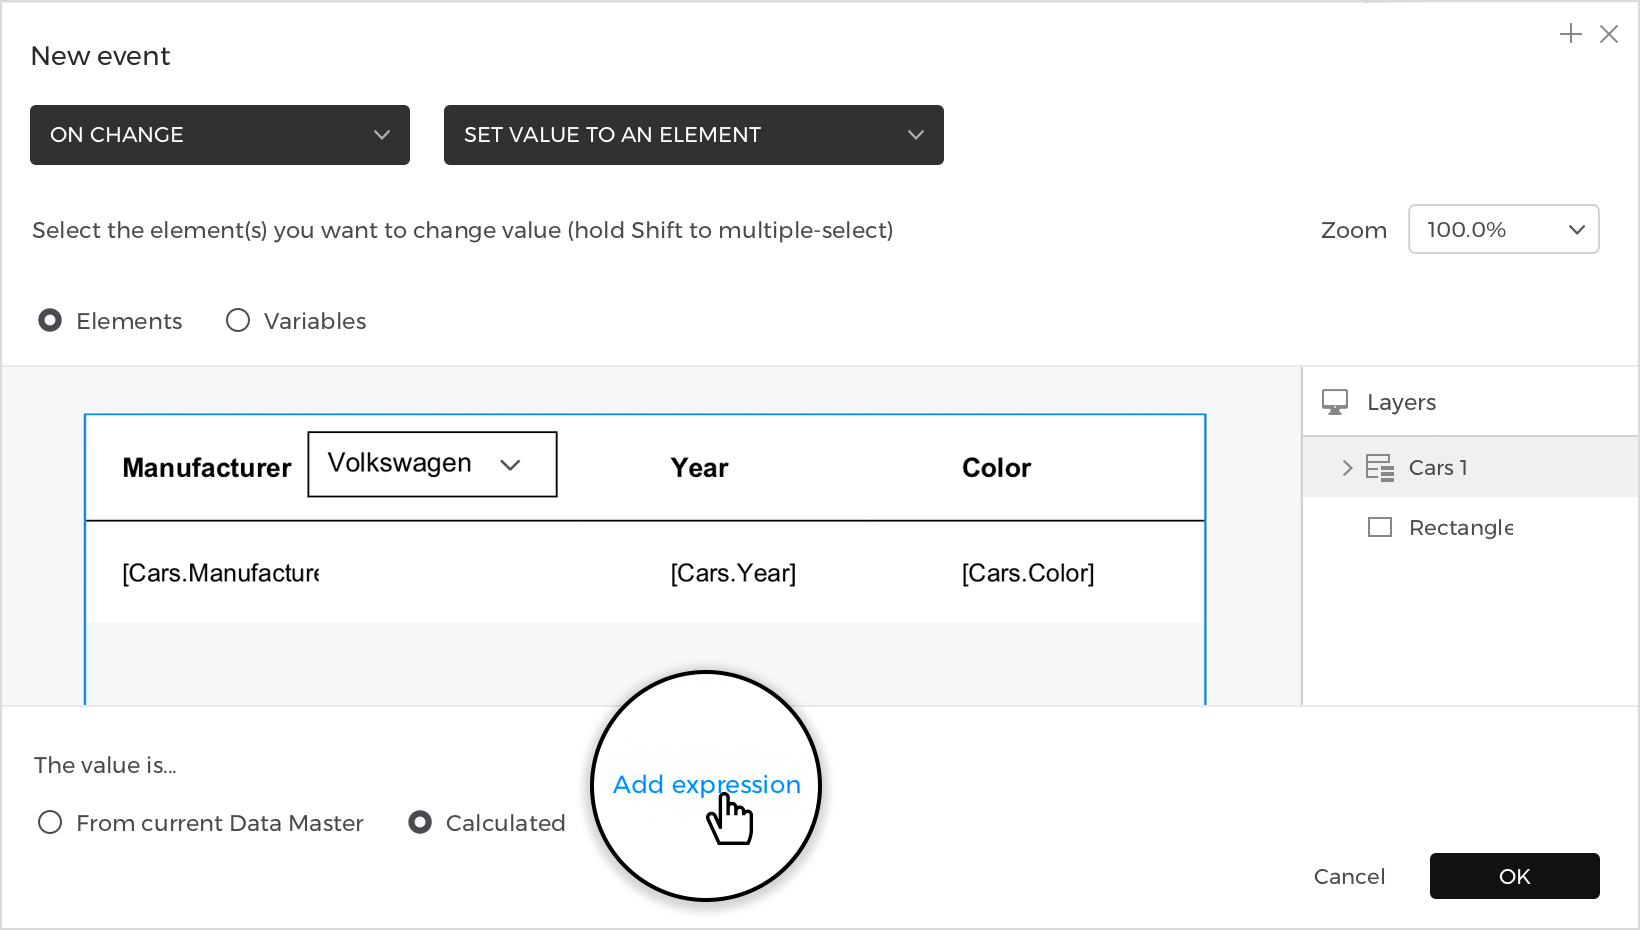
- In the value expression builder first field, drag the function “Filter”, and select your “Data master” from the Data Masters tab for the second field. Next, pull the function “Has” and choose the area you will filter from the Data Masters tab; next, drag the “Select” and place it in the last field. Click “Ok” and “Ok” to finish creating your event.

Simulate your prototype.
Select rows
In this example, you will learn how to create a data list where you can change the color of the row to give it a selection effect.
How to build it:
View
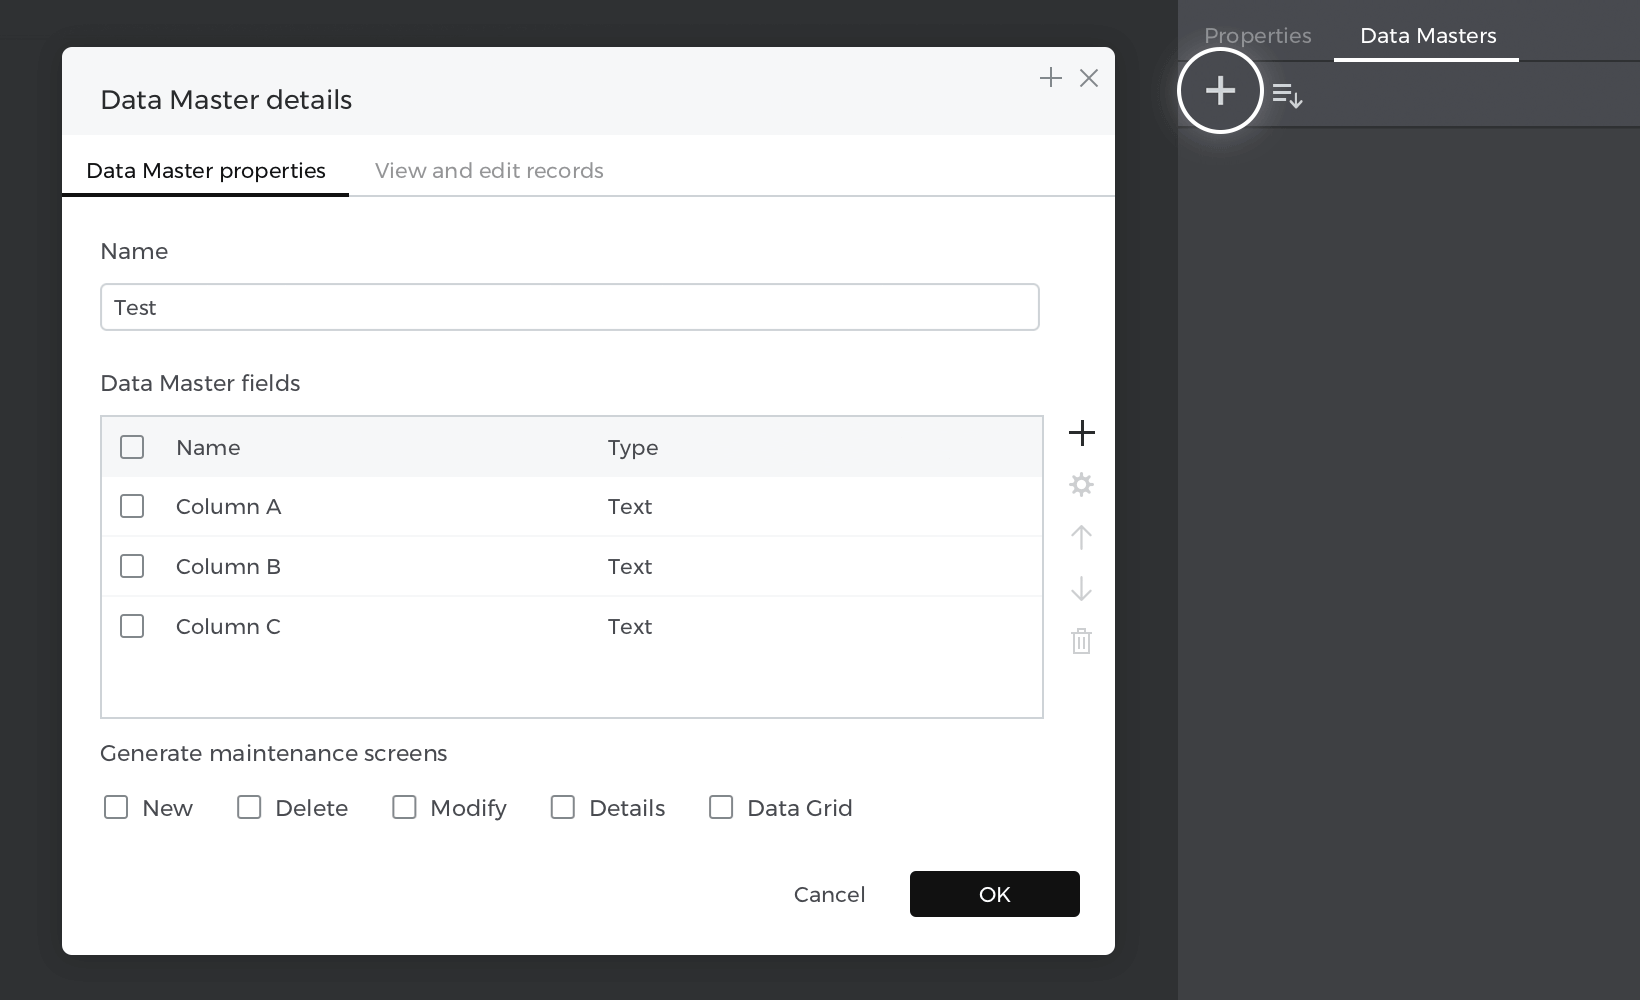
- Go to the Data masters palette and create a new “Data master”, name it “Test” and make three attributes: “Column A”, “Column B” and “Column C”, then press “Ok.

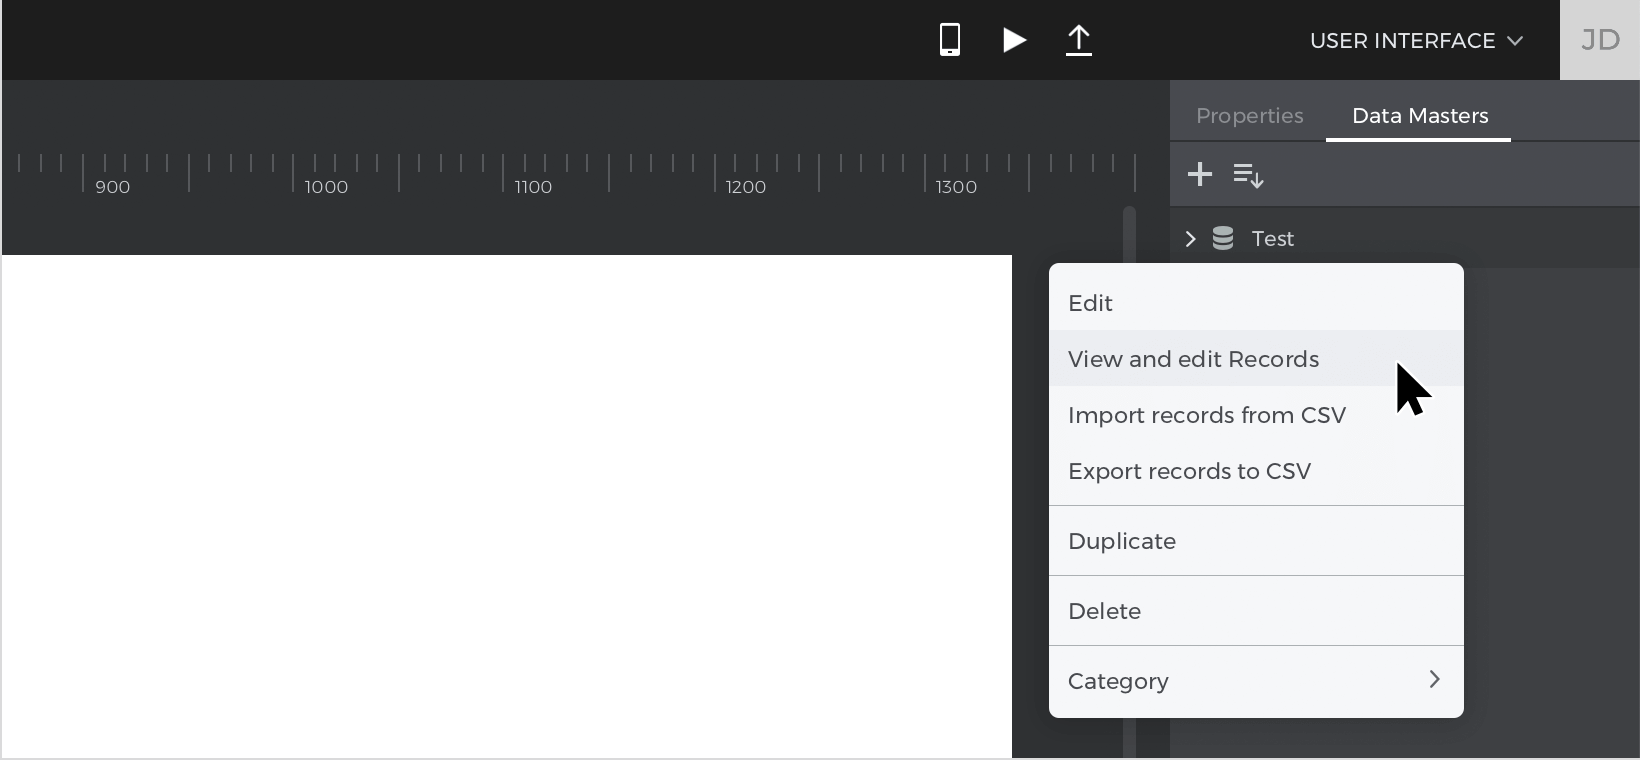
- Right-click on the “Data master” you’ve just created and select “View and edit records”, write your example data there, and press “Ok”.
- Select “Data list” from the “Dynamic content” section and place it on the canvas; the “New data list” window will be enabled; give your list a name, next choose the “Data master” you have created before and select all the attributes.


Events
Place the mouse cursor at the left of the row until it turns into an arrow pointing to the right and click to select the entire row, go to the Events palette and click “Add event”.
- In the dialog box, click on “Choose Trigger”, hover over the “Mouse” section, and select “on Click”.
- In the “Choose Action”, select “Change style” and click on the “Data list”.
- Pick the background color odd and even as default. Click “Ok” to finish creating the event.
Go to the Events palette again and click the “+” to add a new event.
- In the dialog box, click on “Choose Trigger”, hover over the “Mouse” section, and select “on Click”.
- In “Choose Action”, select “Change style” and select the current row in the “Data list”.
- Pick a style background color and set the color blue. Click “Ok” to finish creating the event.
Simulate your prototype.